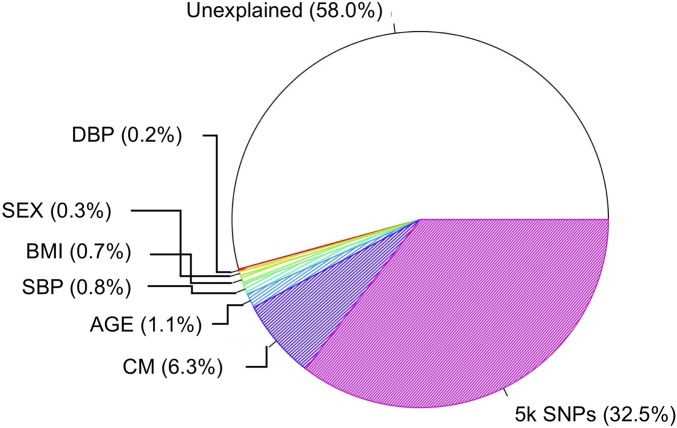
Figure 4.
Proportion of variation explained by each variable in the final model. For six clinical variables [age, sex, body mass index (BMI), systolic blood pressure (SBP), diastolic blood pressure (DBP), and conditional mean (CM)], the individual proportions of variation are shown, whereas variation explained by the 5000 SNPs is shown according to their summed proportion.

