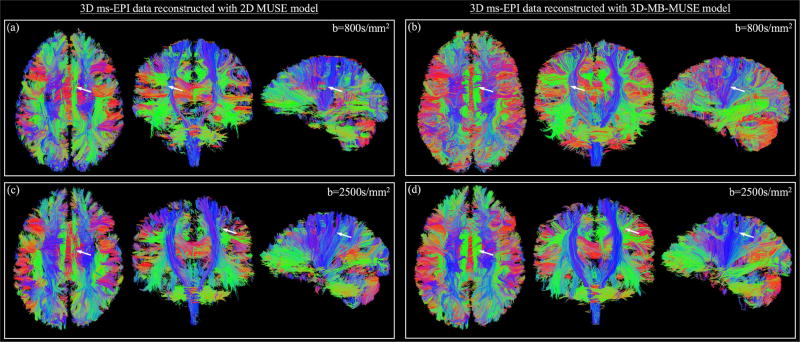
Fig. 8.
Fiber tractography comparison. Streamline fiber tract images generated from 3D ms-EPI dMRI data reconstructed by the 2D MUSE model (a) and 3D-MB-MUSE (b) with b=800s/mm2, and by the respective models with b=2500s/mm2 in (c) and (d). Differences of note between the 2D MUSE and 3D-MB-MUSE reconstructions are highlighted by white arrows.

