Figure 2.

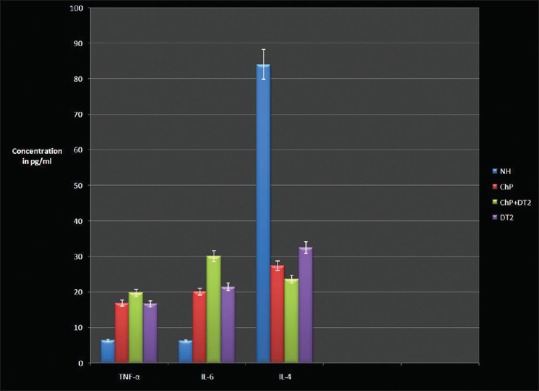
Graphical representation of mean ± standard deviation of TNF-α, interleukin-4 and -6 in the four groups. TNF-α – Tumor necrosis factor-α; IL – Interleukin

Graphical representation of mean ± standard deviation of TNF-α, interleukin-4 and -6 in the four groups. TNF-α – Tumor necrosis factor-α; IL – Interleukin