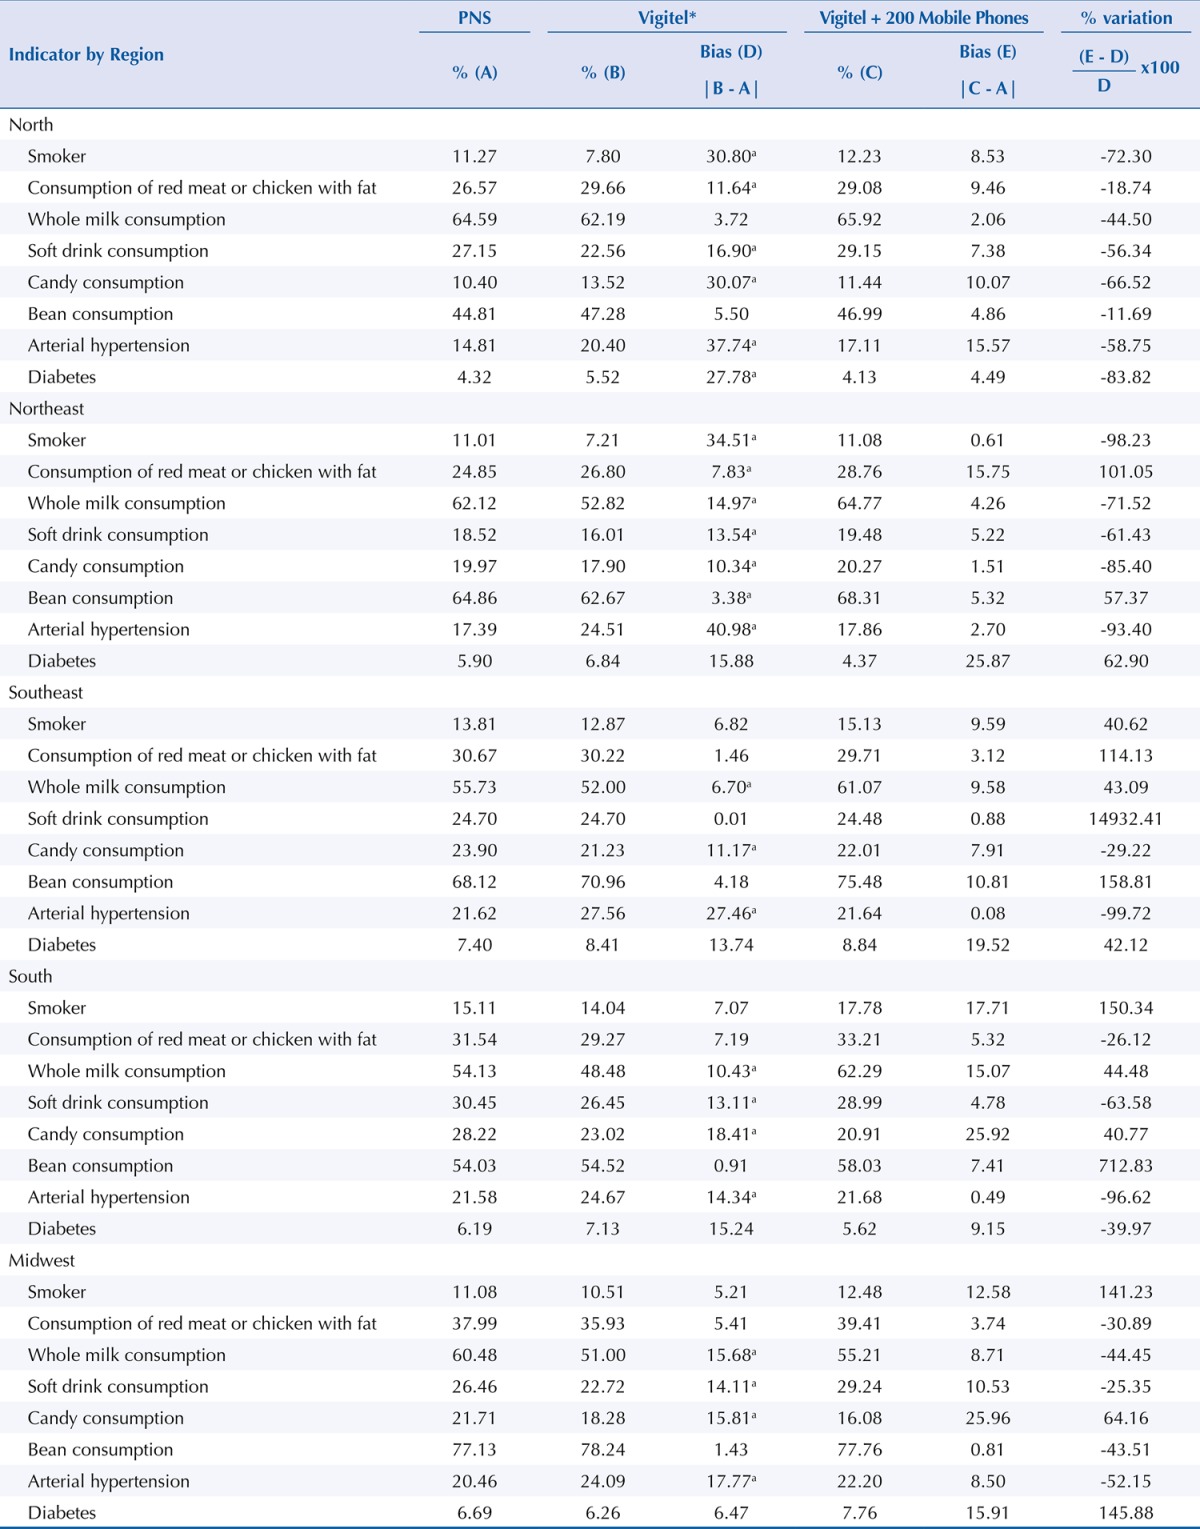
Table 2. Estimates of Vigitel 2013 biases according to indicators by region and sex. Population of adults living in the capitals, 2013.

Note: * Weighted percentage to adjust the sociodemographic distribution of the Vigitel sample to the distribution of the adult population of the city estimated by PNS, 2013.
Vigitel: Surveillance System of Risk and Protection Factors for Chronic Diseases by Telephone Survey.
a non-negligible bias (p-value < 5%).
