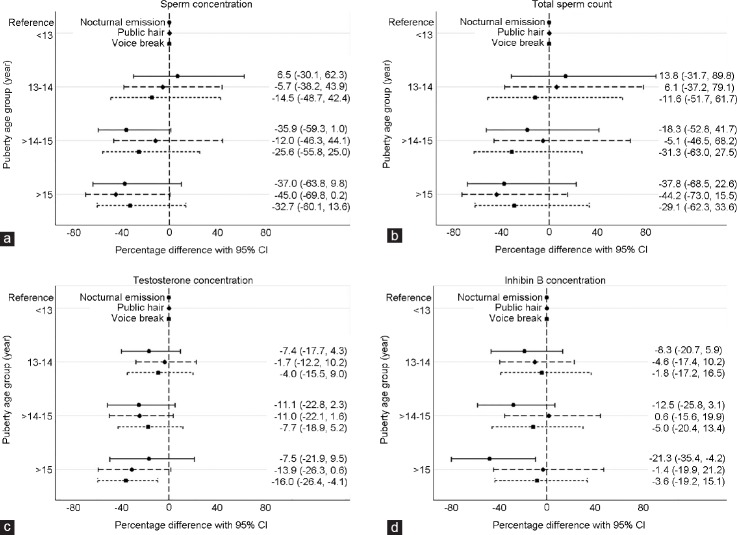
Figure 1.
The percentage difference (95% CI) in sperm concentration, total sperm count, testosterone concentration and inhibin B concentration compared to the reference group (<13 years at pubertal indicators). Nocturnal emission: —, pubic hair: - -, voice break: •••. (a) Sperm concentration (n = 320) – adjusted for maternal body mass index (BMI), smoking and drinking during pregnancy, socioeconomic status, abstinence time, diseases in reproductive organs, spillage and prepubertal BMI. (b) Total sperm count (n = 238) – adjusted for maternal BMI, smoking and drinking during pregnancy, socioeconomic status, abstinence time, diseases in reproductive organs and prepubertal BMI. Excluded if spillage when providing the semen sample (n = 82). (c) Testosterone concentration (n = 320) – adjusted for maternal BMI, smoking and drinking during pregnancy, socioeconomic status, time of blood sample and prepubertal BMI. (d) Inhibin B concentration (n = 320) – adjusted for maternal BMI, smoking and drinking during pregnancy, socioeconomic status, time of blood sample and prepubertal BMI.

