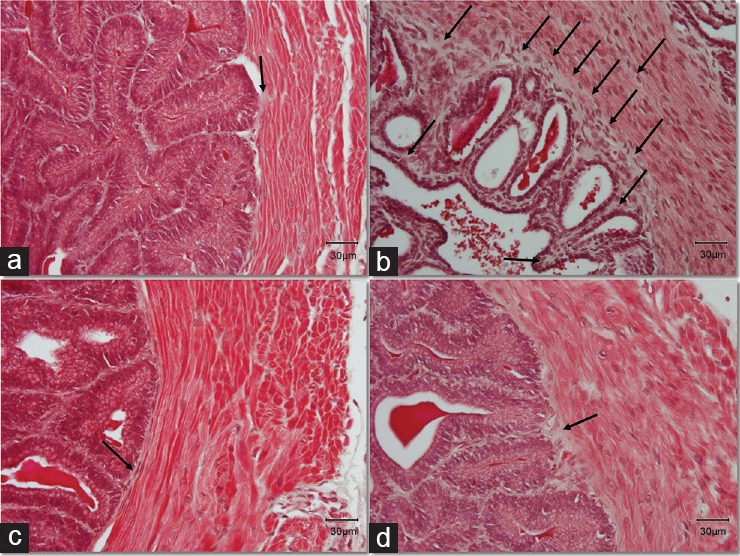
Figure 2.

Masson's trichrome stain indicates increase of connective tissue in the diabetic animals. Black arrows indicate the layer of connective tissue (collagen), stained with a light silver/grey color. Bright red color stain is representing the muscle fibers and the nuclei are stained dark red/purple. Original magnification: ×400. The scale bar is 30 μm. (a) Control group; (b) DM group, untreated diabetic animals; (c) DM/Eda group, diabetic animals treated daily with edaravone 10 mg kg−1, i.p.; (d) DM/Tau group, diabetic animals treated daily with taurine 500 mg kg−1, i.p.
