
Figure 1.
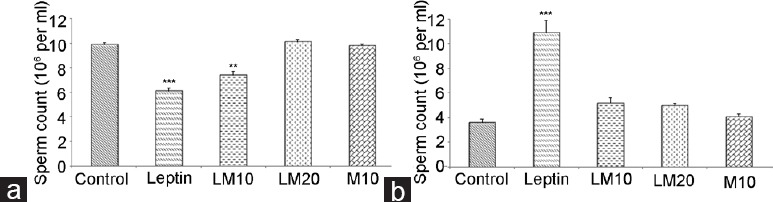
Sperm count (a) and sperm morphology (b) in leptin- and melatonin-treated rats compared to control. **P < 0.01; ***P < 0.001.
Official websites use .gov
A
.gov website belongs to an official
government organization in the United States.
Secure .gov websites use HTTPS
A lock (
) or https:// means you've safely
connected to the .gov website. Share sensitive
information only on official, secure websites.
Sperm count (a) and sperm morphology (b) in leptin- and melatonin-treated rats compared to control. **P < 0.01; ***P < 0.001.