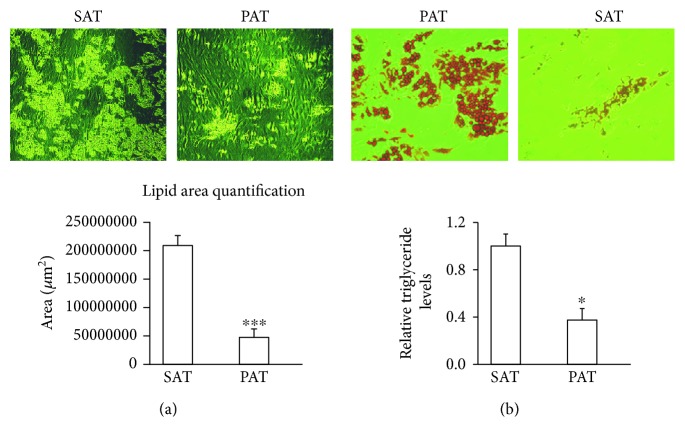
Figure 2.
Adipogenic capacity from precursors of PAT and SAT. (a) Precursor cells from PAT and SAT adipocytes were induced to differentiate into mature adipocytes. Images were acquired after 15 days of differentiation. (b) The surface area of accumulated lipids was determined by dividing the image into four quadrants, which were further subdivided into five zones per quadrant. Data are expressed as means ± SD (n = 4). ∗p < 0.05 indicates the differences in the accumulation of triglycerides between SAT and PAT. ∗∗∗p < 0.001 indicates a statistically significant difference in lipid accumulation in differentiated adipocytes from PAT versus SAT. Relative levels of triglycerides in SAT and PAT were evaluated after the cells reached differentiation. To quantify triglycerides, 1 mL of isopropanol was added for 5 min, to distain the fat deposits. Absorbance was measured at 510 mm wavelength.

