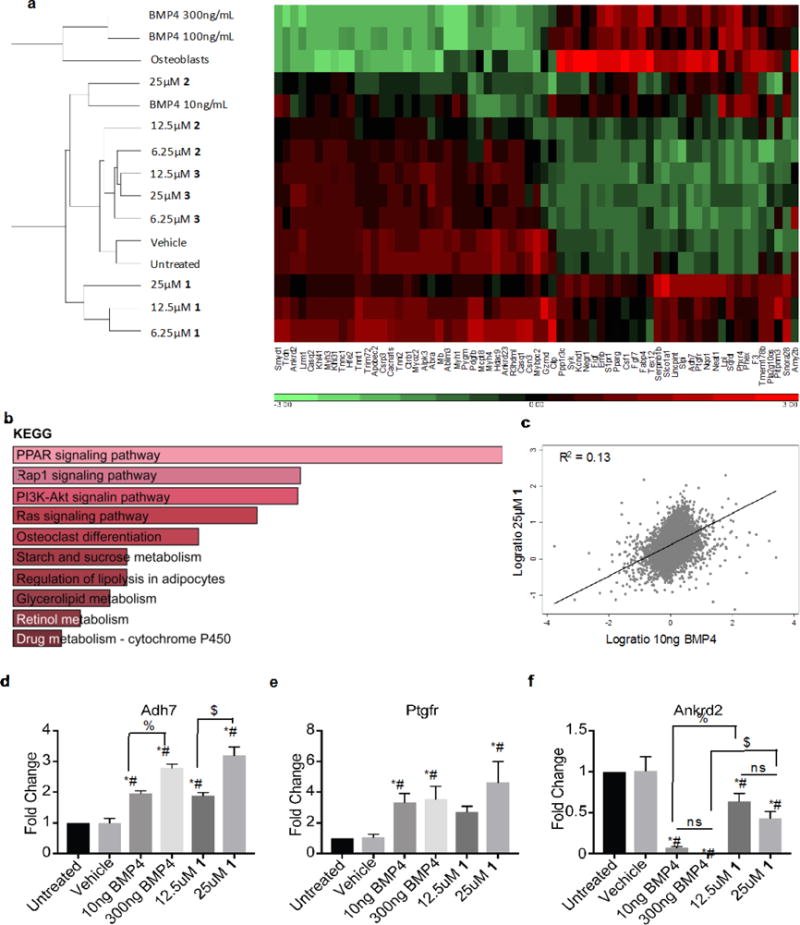
Figure 7. Transcriptional profiling by Affymetrix assay.

RNA expression from C2C12 myoblasts treated for 6 days with BMP4 10, 100, 300ng/ml, compounds at 6.25, 12.5, 25μg/ml, or vehicle. (a) Unsupervised heat map of genes positively or negatively correlated with BMP4 and compound 1. (b) GO analysis of 94 genes induced by at least 0.5 fold by both BMP4 and compound 1. (c) Scatter plot with regression analysis for 10ng BMP4 and 25μM compound 1. qRT-PCR for Adh7 (d), Ptgfr (e), and Ankrd2 (f) from C2C12 cells untreated, or treated with vehicle, 10ng, 300ng BMP4, 12.5μM, 25μM 1. *=significantly different than untreated (p≤0.0169). #=significantly different than vehicle (p≤0.0209). $=treatments significantly different (p≤0.05).
