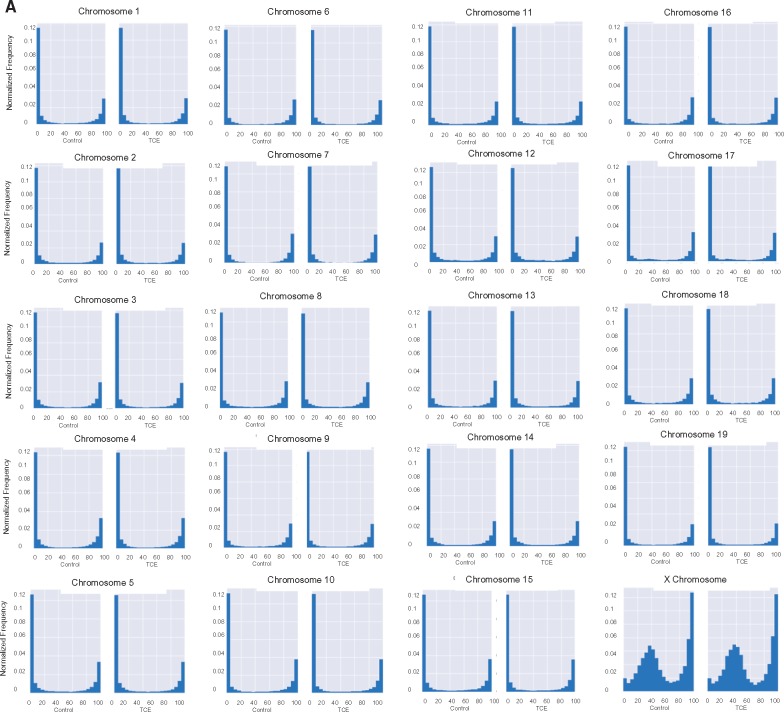
Figure 2:
Chromosome-specific mean DNA methylation levels. (A) The results from the RRBS analysis described in Fig. 1 were sorted into individual chromosomes, and presented after binning for average methylation of the CpGs. The area of each histogram was normalized to one to make it easier to compare the chromosomes. (B) The RRBS results were presented (as total number of CpG sites in the different bins) after excluding the CpG sites that were either 0–5% or 95–100% methylated

