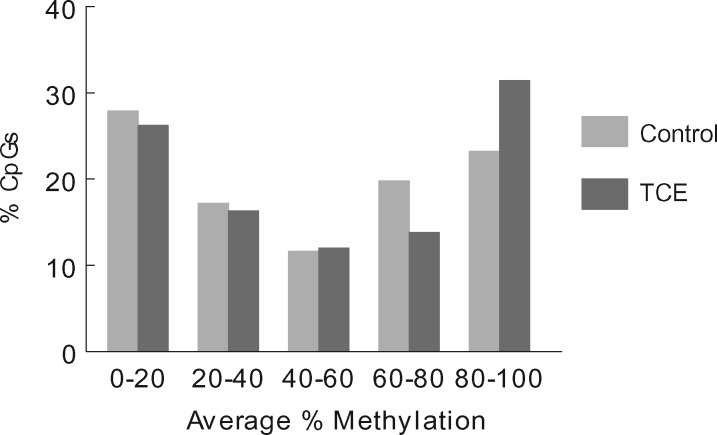
Figure 5:
Average percent methylation of CpG sites differentially methylated by TCE. RRBS analysis of effector/memory CD4+ T cells from control and TCE-treated mice revealed 233 DMS (methylation difference ≥ 10%, q value < 0.005). These DMS were sorted separately for control and TCE-treated samples and binned for mean methylation

