
Figure 1.
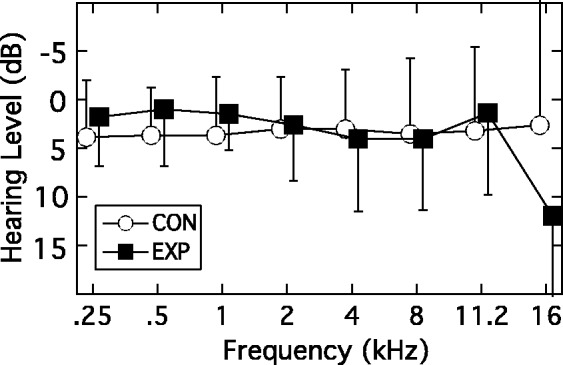
Mean audiograms for the test ear for the EXP group (filled squares) and CON group (unfilled circles). Error bars are 1 standard deviation (SD). See text for participant numbers for the two highest frequencies.
EXP = experimental; CON = control.