
Figure 2.
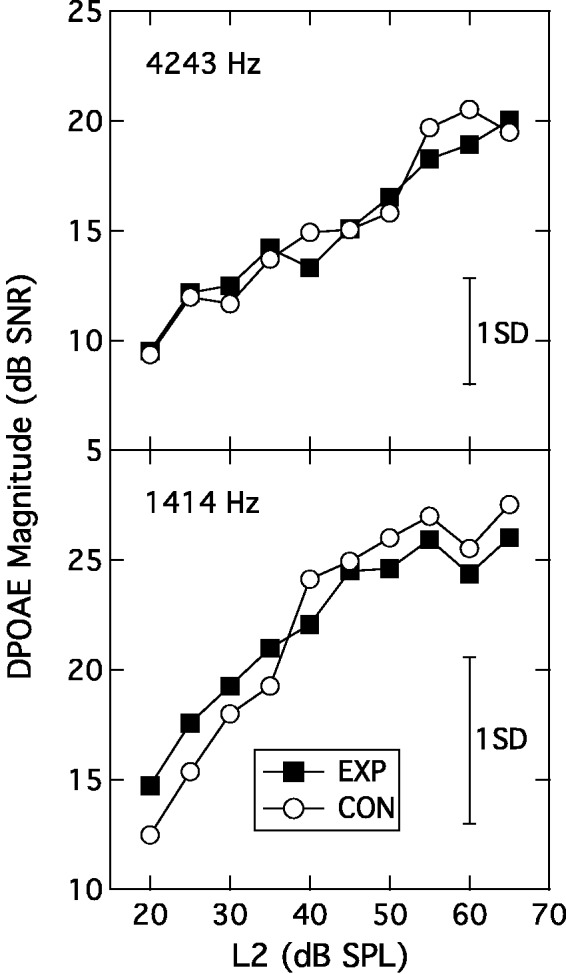
Input-output functions at 4243 Hz (upper panel) and 1414 Hz (lower panel) plotting signal-to-noise ratio as a function of L2. The parameter is participant group. Error bars are 1 SD.
EXP = experimental; CON = control; DPOAE = distortion product otoacoustic emission.