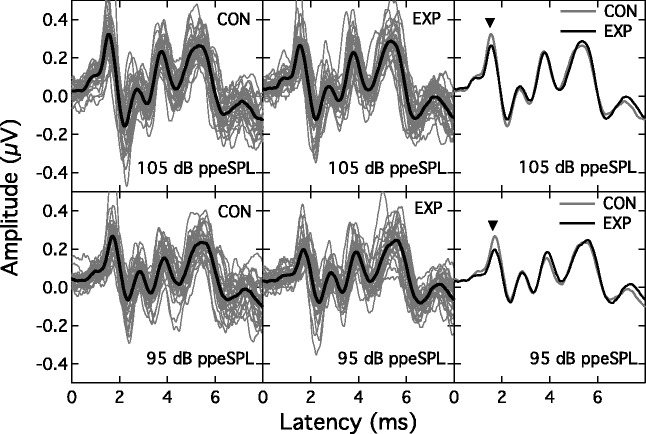
Figure 3.
ABR traces for the CON group (left panels) and EXP group (middle panels) for the 95 - and 105-dB ppeSPL presentation levels (lower and upper rows, respectively). Light traces are individual ABRs, heavy trace is group mean. The group mean traces are overlaid in the right panels, with an inverted triangle indicating Wave I.
EXP = experimental; CON = control.

