Figure 6.
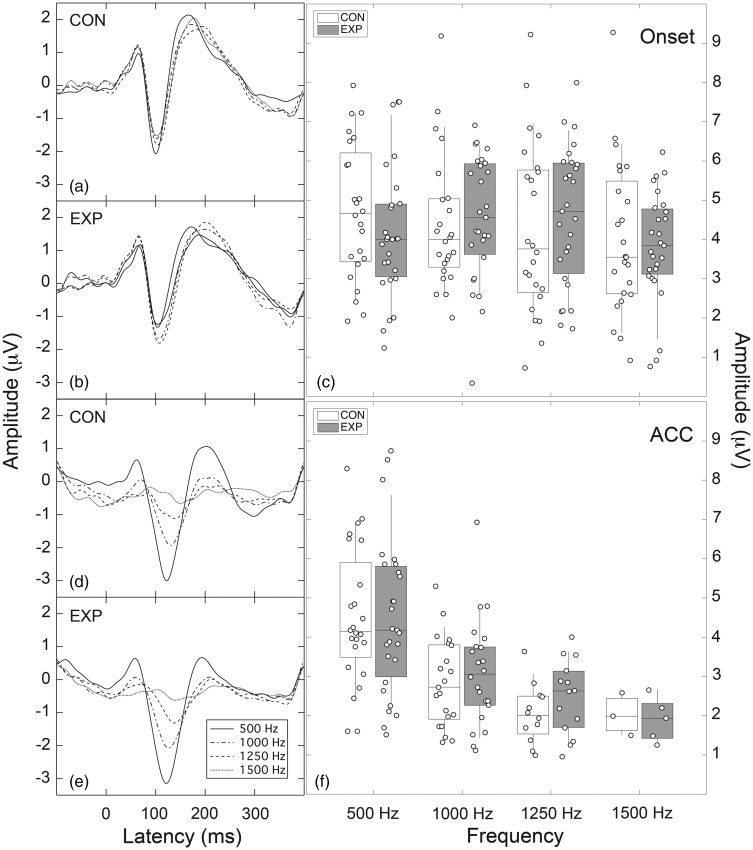
Left panels: Panels a and b show grand average P1-N1-P2 onset responses for the CON and EXP groups, respectively; Panels d and e show grand average P1-N1-P2 ACC responses for the CON and EXP groups, respectively. Parameter is noise-band center frequency. Right panels: Panel c shows distribution of N1-P2 amplitudes as a function of frequency for onset responses; Panel f shows complementary distribution for ACC responses. Individual data points (circles) are superimposed on boxplots where rectangles denote the 25th to 75th percentiles (CON: unfilled; EXP: filled); the horizontal bar within each rectangle is the median, and the vertical lines extend out to the 10th to 90th percentiles.
EXP = experimental; CON = control; ACC = acoustic change complex.

