. 2017 Aug 3;8(10):7138–7142. doi: 10.1039/c7sc01628j

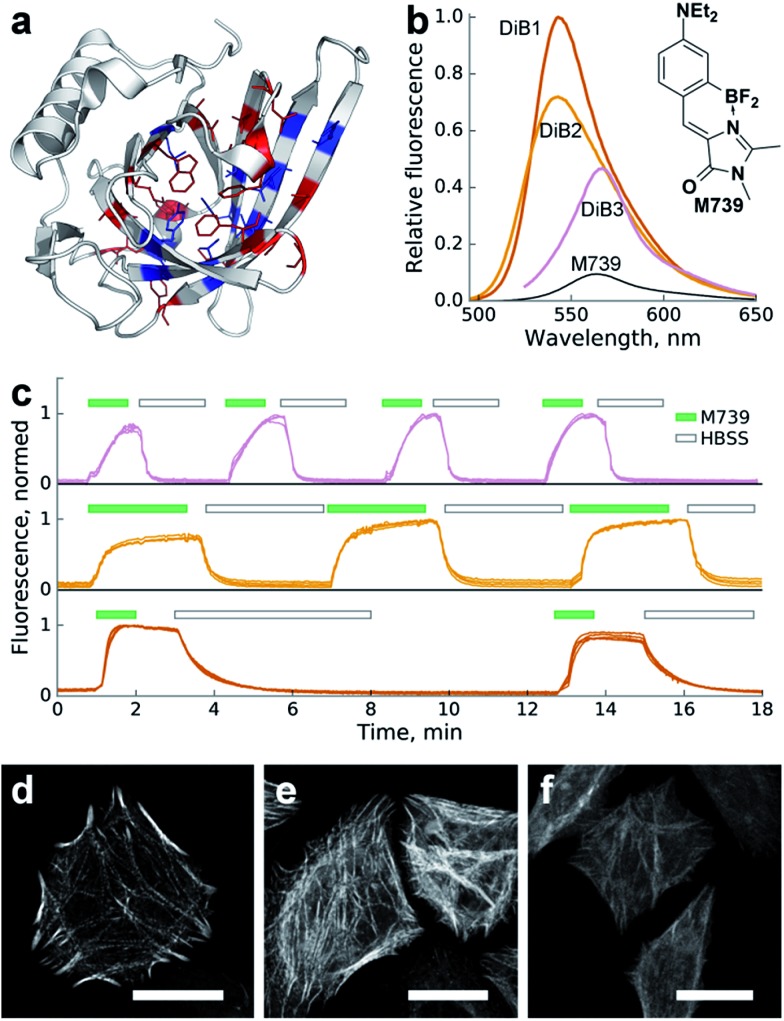
Fig. 1. Characterization of the Blc mutants in a complex with chromophore M739in vitro and in cellulo. (a) Locations of the amino acid sites of Blc analyzed in this work, highlighted in the wild-type crystal structure (PDB ID: ; 1QWD). Pocket-facing amino acid positions are colored. Sites with mutations tested in vitro are shown in blue. (b) Changes in fluorescence upon complex formation. Shown are emission spectra of the same concentration of M739 (free or in the presence of saturating amounts of the corresponding proteins) normalized for the DiB1 maximal value. (c) Sequential staining and washout of H2B with DiBs in live HeLa cells. Top-to-bottom: DiB3, DiB2 and DiB1. The green filled and black hollow rectangles above the curves designate addition of the M739 solution (0.5 μM) or washout with HBSS buffer, respectively. Multiple intensity profiles correspond to different cells; on-to-off signal ratios are approximately 30, 15, and 30 for DiB3, DiB2, and DiB1, respectively. (d–f) Confocal fluorescence microscopy of DiBs in a HeLa cell line; (d) α-actinin-DIB1 in the presence of 0.25 μM M739 (excitation: 488 nm, emission: 520–560 nm); (e) α-actinin-DIB2 in the presence of 1 μM M739 (excitation: 488 nm, emission: 520–560 nm); (f) α-actinin-DIB3 in the presence of 5 μM M739 (excitation: 543 nm, emission: 560–600 nm). Scale bars – 20 μm.

Fig. 1