. 2017 Aug 3;8(10):7138–7142. doi: 10.1039/c7sc01628j

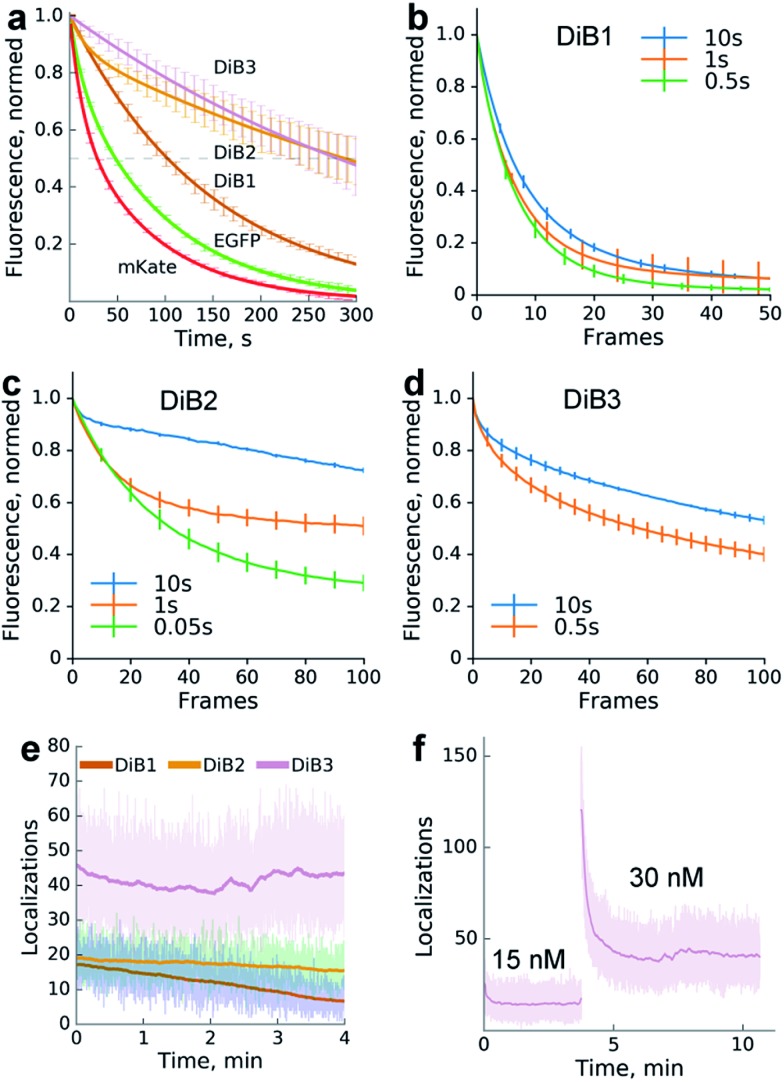
Fig. 2. Photostability of the protein-PAINT labeling system. Live-cell performance of the protein-PAINT labeling system. (a) Photobleaching curves of HEK293T expressing H2B fused with Blc mutants and stained with chromophore M739 in a confocal setup. Curves for H2B-EGFP and H2B-mKate under the same imaging conditions are provided for comparison. mKate and DiB3: a 55.4 μm2 region was scanned with a 20 μW 543 nm laser. EGFP, DiB2 and DiB1: a 3542 μm2 region was scanned with a 100 μW 488 nm laser. Lines – two-term exponential fitting; error bars – s.d. (b–d) The impact of the imaging regime on DiBs photostability. Plots show the photobleaching curves obtained by collecting widefield images with different time gaps between ‘bleaching’ frames ((b and d) 1 s and (c) 0.1 s bursts of ∼60 W cm–2 light) for live HEK293T cells expressing H2B fused with DiB1, DiB2, and DiB3 in the presence of 0.5, 5, and 10 μM M739, respectively. (e and f) Photostability in the single-molecule imaging (TIRF) setup. The graph shows the number of localizations per frame (an ∼50 μm2 region of the frame is illuminated with 4.5 W cm–2 488 nm or 120 W cm–2 561 nm laser light in TIRF mode). The laser illumination occurred without intermittence, and the frames were taken with 16 ms exposure. (f) Prolonged single molecule imaging with DiB3 in the presence of 15 and 30 nM M739. Note that the addition of the chromophore solution to the cell medium immediately results in an increased number of localization events.

Fig. 2