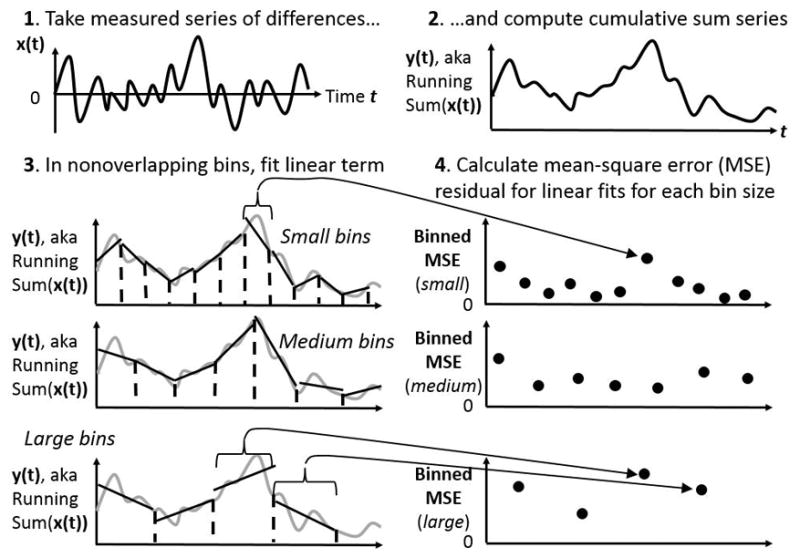
Figure 1.

Schematic of initial steps in detrended fluctuation analysis (DFA). The first panel (top left) schematizes the measured series. The second panel (top right) schematizes the cumulative sum over time. The third panel (bottom left) schematizes the fitting of linear trends to nonoverlapping bins of the cumulative sum from the second panel, depicting the cumulative sum series in grey curves, the trend lines in solid black lines, and the bin boundaries in dashed black vertical lines. The fourth panel (bottom right) schematizes the mean squared error (MSE) of residuals left over from each bin’s linear fit in the bottom-left panel. In both bottom panels, the MSEs on the right correspond to the linear fits on the left, for small, medium, and large bins.
