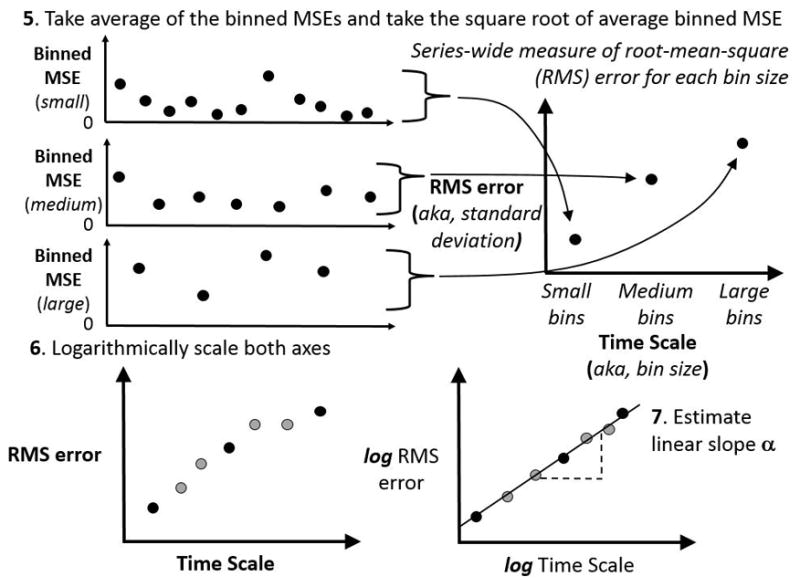
Figure 2.

Schematics of concluding steps in DFA algorithm. As the top panels show, the MSE values depicted in Figure 1 contribute to an average whose square root is a root mean-square (RMS) error statistic, and each bin size has a corresponding RMS statistic. The bottom panels schematize, on the left, the plot of RMS statistics for each bin size with newer grey circles representing other RMS values for intermediate bin sizes not schematized in these figures and, on the right, a logarithmic scaling of the RMS error and a logarithmic scaling of the time scale represented by the bin sizes. The lower right panel schematizes the possibility that this RMS function, once logarithmically transformed, can yield a linear relationship whose slope is an estimate of the power-law exponent.
