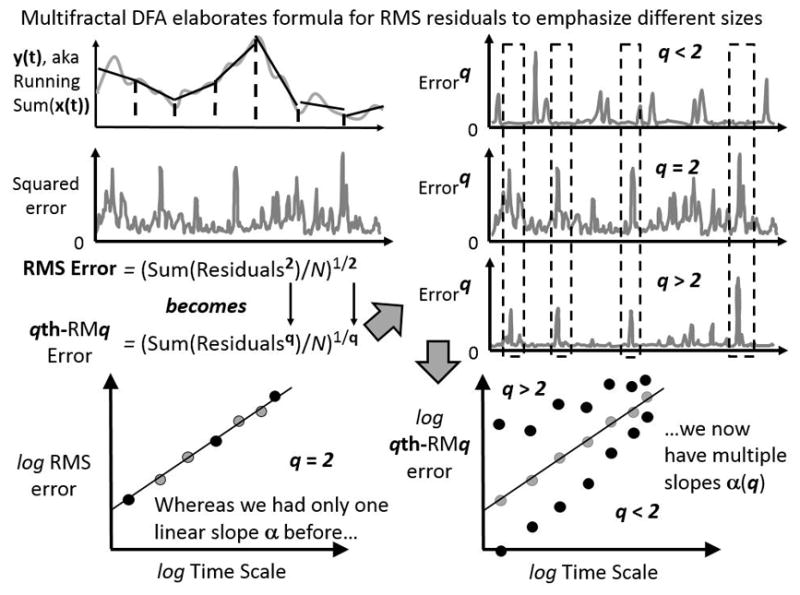
Figure 3.

Schematic of multifractal elaboration of the detrended fluctuation analysis (DFA) algorithm. In this schematic, we consider the entire series of squared residuals left over from the binned detrending (top left panel). What multifractal DFA does is to introduce a parameter q that, for standard DFA, only equals 2. Different values of q amplify residuals of different size. As the top-right panel shows, residuals raised to the exponent q is equivalent to squared residuals for standard DFA, residuals raised to exponents q greater than 2 leave large errors relatively large while diminishing smaller errors, and residuals raised to exponents q less than 2 amplify small errors and diminish larger errors. The bottom panels show how, whereas DFA uses a single series of squared residuals, multifractal DFA uses as many series of error-raised-to-exponent-q as there are values of q. Each series of error-raised-to-exponent-q contributes to a specific relationship between qth-RMq and bin size, yielding potentially many linear relationships on logarithmic axes and so potentially many slopes.
