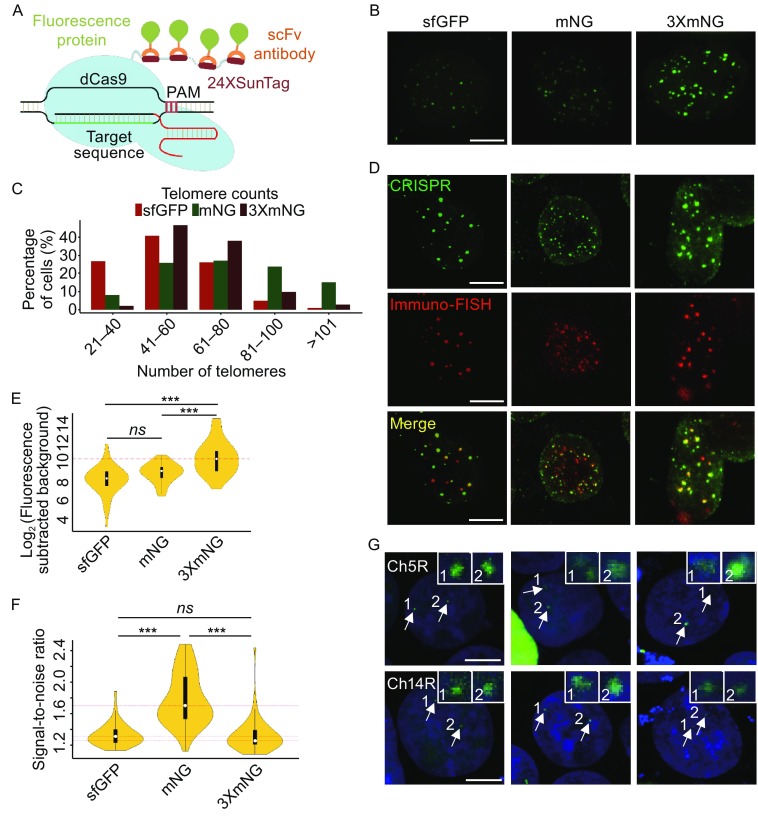
Figure 1.
Live cell imaging of genomic loci using dCas9-SunTag system and a bright fluorescent protein. (A) Schematic of dCas9-SunTag system combined with sfGFP, mNeonGreen (mNG) or 3XmNeonGreen (3XmNG). (B) Visualizing human telomeres with CRISPR/Cas9 system using different fluorescent proteins. HEK293T cells were transfected with sgTelomere and dCas9-SunTag system combined with sfGFP, mNeonGreen and 3XmNeonGreen, respectively. 48 h after transfection, cells were imaged by confocal laser scanning microscope. Scale bar, 2 μm. (C) Histogram of telomere punta counts per cell detected by sfGFP, mNeonGreen, and 3XmNeonGreen (N = 66, 62, and 60 cells, respectively). (D) Co-localization of telomeres using sfGFP, mNeonGreen, 3XmNeonGreen (top), and FISH (middle). Scale bar, 5 μm. (E and F) CRISPR fluorescence intensity and signal-to-noise ratio of labelled telomere foci. N = 50 cells for each analysis and the dot within the vioplot represents the median value. (G) Two low-repeat genomic loci were labeled with different fluorescence proteins. Ch5R and Ch14R sites contain 21 and 15 copies of repeats, respectively. The experiment procedure is similar to telomere labeling. Nuclei were counterstained with the live staining dye Hoechst33342. Scale bar, 5 μm. All images are achieved by maximum intensity projections from Z-stacks

