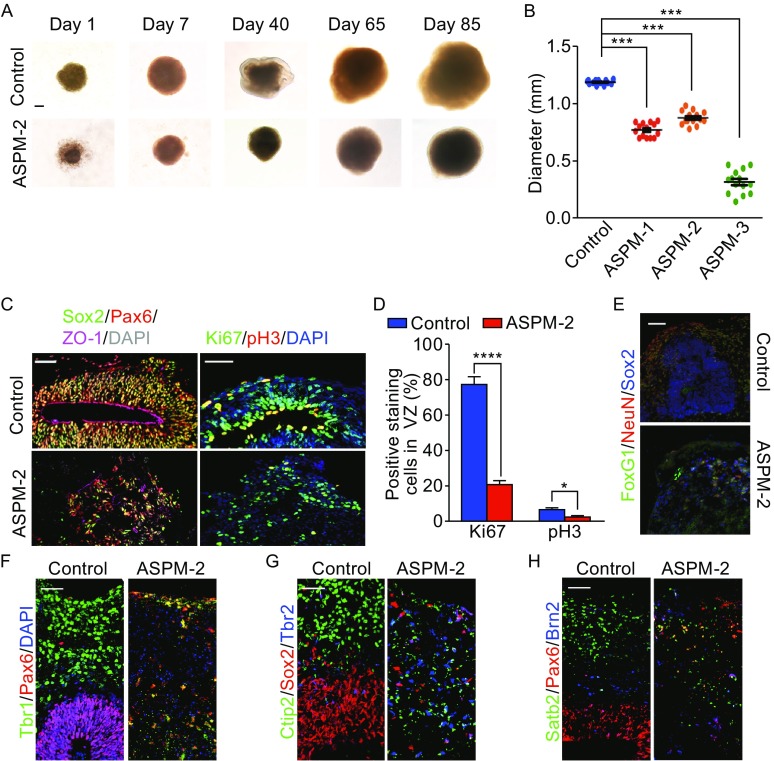
Figure 4.
Human ASPM mutant organoids show disrupted cerebral development. (A) Representative BF images of control and ASPM-2 organoids at different stages. (B) The diameter of organoids generated from each hiPSC lines. (C) Immunostaining of NE markers in control and ASPM-2 organoids. (D) The percentage of Ki67+ and pH3+ cells in VZ of the developing organoids. n = 3, 3 slices for control and ASPM-2 group. (E) Immunostaining for progenitor markers of control and ASPM-2 organoids on day 65. (F) Immunostaining of telencephalic, neuronal and progenitor marker of control and ASPM-2 organoids on day 65. (G–I) Immunostaining results for progenitor and pyramidal markers of control and ASPM-2 organoids on day 65. All data are presented as means ± s.e.m. *P < 0.05; ***P < 0.001; ****P < 0.0001. Scale bar: 200 μm in (A), 50 μm in (C, E–I)

