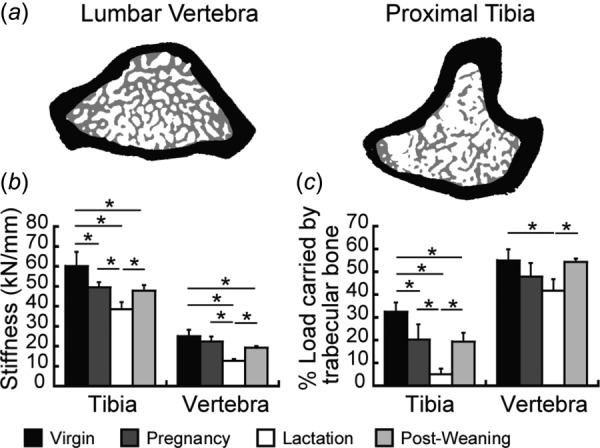
Fig. 3.

Finite element analysis (FEA). (a) Schematic illustrating the isolation of trabecular (gray) and cortical (black) compartments at L4 (left) and the tibia (right) for calculation of load-share fraction. (b) Whole-bone stiffness and (c) trabecular load-share fraction in virgin, pregnancy, lactation, and 6-week post-weaning groups. * indicate significant differences among groups (p < 0.05).
