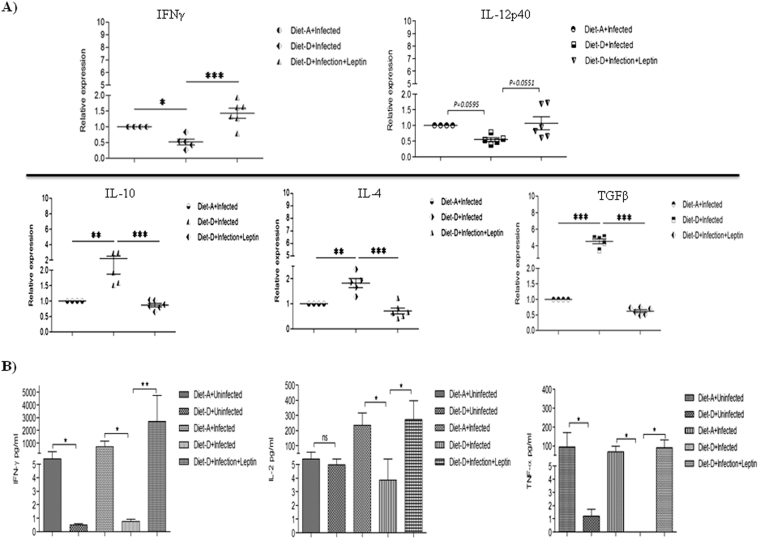
Figure 5.
Gene expression analysis in the spleen of mice. (A) RT-qPCR analysis of Th1 and Th2 specific cytokines relative expression. In comparison between the infected groups of both the diets, the Th1 cytokines such as IL-12p40 (p = 0.0595) and IFN-γ was significantly downregulated, and the Th2 cytokines such as IL-10, IL-4, and TGF-β were significantly upregulated in the diet-D. Whereas, in the comparison between the infected diet-D and its leptin-treated group, IL-12p40 (p = 0.0551) and IFN-γ were significantly upregulated, and the Th2 cytokines were significantly down-regulated in the leptin-treated group. (B) Flow cytometry analysis of Th1 specific cytokine concentration (pg/ml) in SLA-stimulated splenocytes culture supernatant with mean ± SD. In comparison between the uninfected groups of both the diets, IFN-γ and TNF-α were produced at the lower rate in the diet-D compared to diet-A. In comparison between the infected groups of both the diets, IFN-γ and IL-2 were produced at the lower rate in the diet-D compared to diet-A. Whereas, in the comparison between the infected diet-D and its leptin treated group, IFN-γ, IL-2, and TNF-α were produced in abundant quantity in the leptin-treated group. Collective data of two independent experiments are shown.

