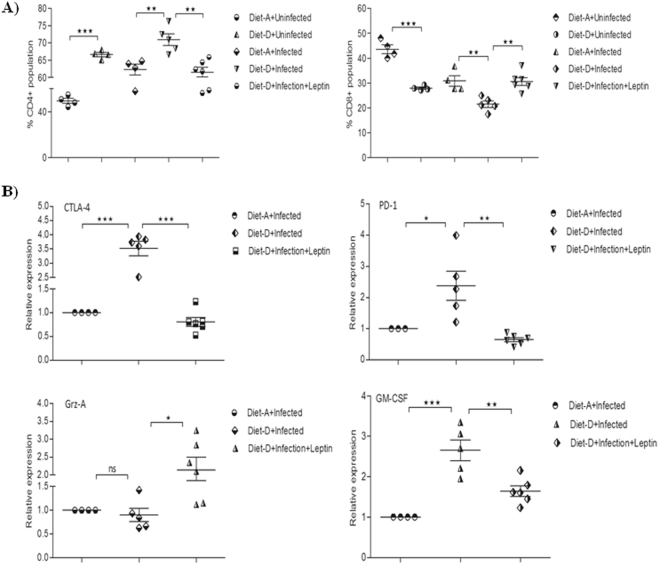
Figure 6.
Percentage of T-cell subpopulations in VL spleen of mice. (A) In comparison between the uninfected groups and between the infected groups of both the diets, the CD4+ population was significantly increased and the CD8+ population was significantly decreased in the diet-D. Whereas, in the comparison between the infected diet-D and its leptin-treated group, the CD8+ population was significantly increased and the CD4+ population was significantly decreased. (B) RT-qPCR analysis of exhaustive T-cell markers, Grz-A, and GM-CSF relative expression. In comparison between the infected groups of both the diets, the exhaustive T-cell markers (CTLA-4 and PD-1) and GM-CSF were significantly upregulated, and Grz-A was found to be unaltered in the diet-D. Whereas, in the comparison between the infected diet-D and its leptin-treated group, both the exhaustive markers and GM-CSF were significantly downregulated, and Grz-A was significantly upregulated in the leptin-treated group. Collective data of two independent experiments are shown.

