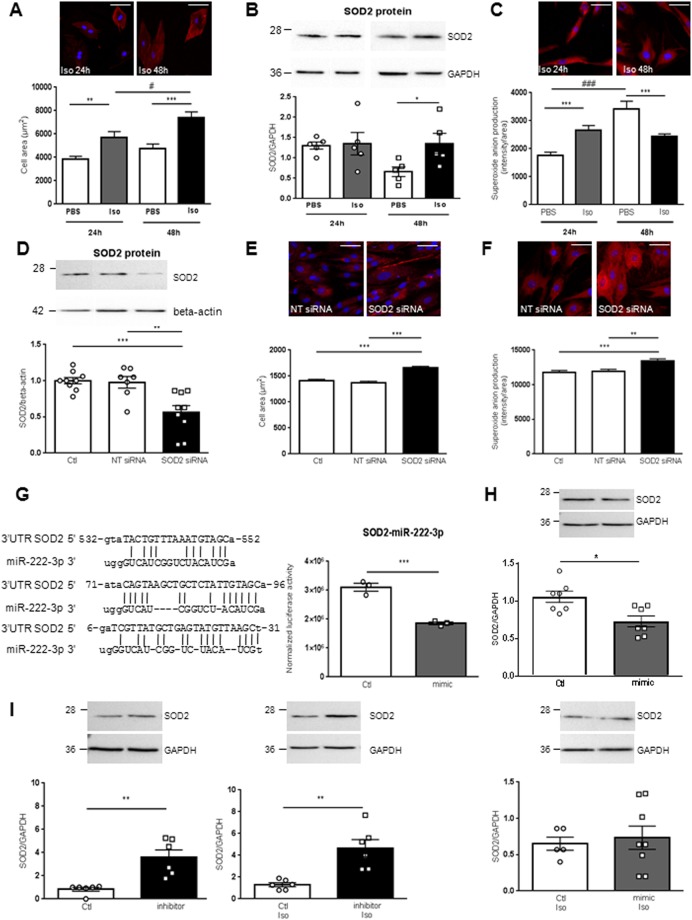
Figure 2.
Role of SOD2 and its post-transcriptional regulators in cardiac hypertrophy. (A) Representative immunofluorescence of alpha-actinin (red) in H9c2 cardiomyoblasts Iso treated for 24 h and 48 h (top panel). Quantification after 24 h and 48 h of cell area was performed from 3 independent experiments and at least 28 cells untreated (PBS) or Iso treated. Graph shows mean ± SEM values expressed as cell area (µm2) (lower panel). (B) Representative western blot of SOD2 protein in H9c2 cardiomyoblasts untreated or Iso treated for 24 h and 48 h (top panel). Quantification was performed from at least 4 independent experiments. Data were normalized to GAPDH and graph shows mean ± SEM values expressed as SOD2/GADPH (lower panel). (C) Representative immunofluorescence of mitoSOX (red) in H9c2 cardiomyoblasts Iso treated for 24 h and 48 h. Mitochondrial superoxide anion production was quantified from 3 independent experiments and at least 60 cells. Graph shows mean ± SEM values expressed as superoxide anion production intensity/cell area (lower panel). (D) Representative western blot of SOD2 protein in H9c2 cardiomyoblasts control (Ctl: only DharmaFECT® reagent) or transfected with non-target (NT siRNA) or SOD2 siRNA for 72 h (top panel). Quantification of SOD2 was performed from at least 5 independent experiments. Data were normalized to beta-actin and graph shows mean ± SEM values expressed as SOD2/beta-actin (lower panel). (E) Representative immunofluorescence of alpha-actinin (red) performed in H9c2 cardiomyoblasts Ctl or transfected with NT or SOD2 siRNA for 72 h (top panel). Quantification of cell area was performed from 3 independent experiments and at least 193 cells. Red intensity measured for each cell was normalized to the cell area and graph shows mean ± SEM values expressed as cell area (µm2) (lower panel). (F) Representative immunofluorescence of mitoSOX (red) performed in H9c2 cardiomyoblasts Ctl or transfected with NT or SOD2 siRNA for 72 h (top panel). Mitochondrial superoxide anion production was quantified from 3 independent experiments and at least 182 cells. Red intensity measured for each cell was normalized to the cell area and graph shows mean ± SEM values expressed as superoxide anion production intensity/cell area (lower panel). Nuclei were stained with Hoechst (blue). Scale bar is 50 µm (A, C, E, F). (G) Sequence of the three binding sites of miR-222-3p identified on human 3′-UTR SOD2 with miRTarBase (Release 6.0: Sept. 15, 2015) (left panel). Quantification of luciferase activity in HEK293 cells after transfection of control (white) and miR-222-3p mimic (grey) (right panel). Data were obtained from 3 independent experiments and graph shows mean ± SEM values expressed as normalized luciferase acivity. (H) Representative western blot of SOD2 in human cardiomyocytes either control (white) or transfected by miR-222-3p mimic (grey) in untreated (top panel) or treated with Iso for 48 h (lower panel). Quantification of SOD2 in human cardiomyocytes was obtained from 4 independent experiments. Data were normalized to GAPDH and graph shows mean ± SEM values expressed as SOD2/GADPH. (I) Representative western blot of SOD2 in human cardiomyocytes either control (white) or transfected by miR-222-3p inhibitor (black) in untreated (left panel) or treated with Iso for 48 h (right panel). Quantification of SOD2 in human cardiomyocytes was obtained from 4 independent experiments. Data were normalized to GAPDH and graph shows mean ± SEM values expressed as SOD2/GADPH *p < 0.05; **p < 0.01; ***p < 0.001.

