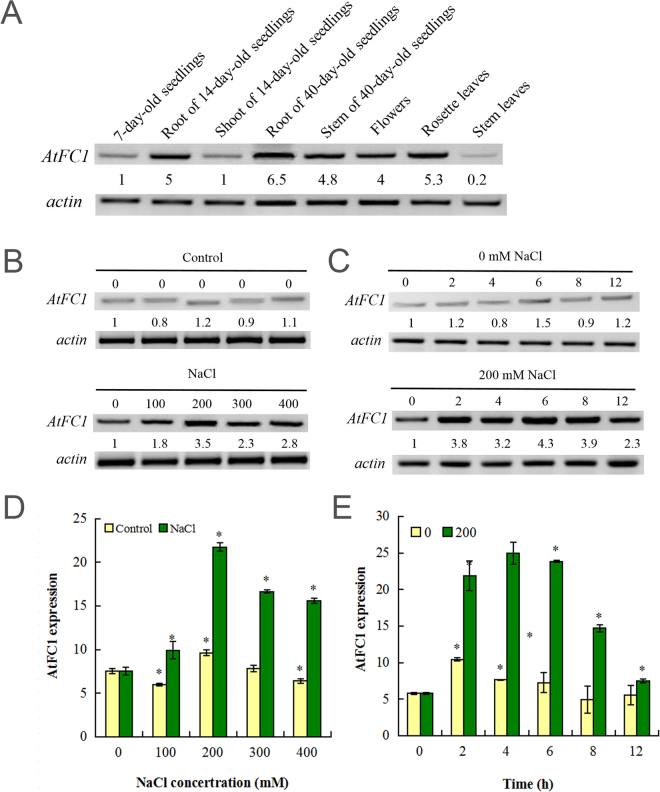
Figure 1.
Expression pattern of AtFC1 in Arabidopsis and its regulation by NaCl treatment. (A) Semi-quantitative RT-PCR (sqRT-PCR) analysis of AtFC1 expression at different developmental stages. B-E: sqRT-PCR and qRT-PCR analyses of AtFC1 expression in response to salt stress. Two week-old seedlings growing in MS media were exposed to 0–400 mM NaCl for 5 h (B,D) or 200 mM NaCl for 0–12 h (C,E). Total RNA was extracted from whole plants and transcripts were analyzed by sqRT-PCR (B,C) and qRT-PCR (D,E). Actin primers were used in PCR as an internal control. The number below the band indicates the relative abundance of the corresponding transcripts with respect to the loading control. Vertical bars represent mean values ± SE. Asterisk indicates the significant difference in expression between the treatments and control (p < 0.05). The color of images for sqRT-PCR was inversed. The uncropped images are shown in Supplementary Data 8.

