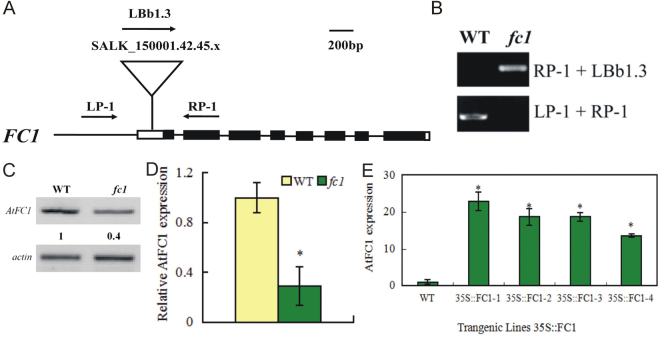
Figure 2.
Identification of fc1 mutant and 35 S::AtFC1 transgenic lines in Arabidopsis. (A) Schematic diagram of AtFC1 structure and T-DNA diagnostic PCR and RT-PCR. The coding region and 5’ and 3’ untranslated regions are illustrated by the black and white boxes, respectively; introns are indicated by lines. The position of the T-DNA insertion is indicated by a triangle. The locations of the primer pairs used to analyze the mutation by RT-PCR are indicated by arrows. (B) RT-PCR analysis of the fc1 insertion mutant. The reverse transcription products were PCR-amplified using primer pairs LP-1 + RP-1, LP-1 + LBb1.3. (C) RT-PCR analysis of AtFC1 transcript levels in fc1 mutant. (D) qRT-PCR analysis of AtFC1 transcript levels in fc1 mutant. E: qRT-PCR analysis of AtFC1 transcript levels in 35 S::AtFC1 lines. Fourteen day-old seedlings were used for RT-PCR analysis. The number below the band indicates the relative abundance of the corresponding proteins with respect to the loading control. Vertical bars represent mean values ± SE. Asterisk indicates the significant difference in expression between the fc1 mutant/35 S::AtFC1 lines and wild type (p < 0.05). The color of image in C was inversed. The uncropped images are shown in Supplementary Data 9.

