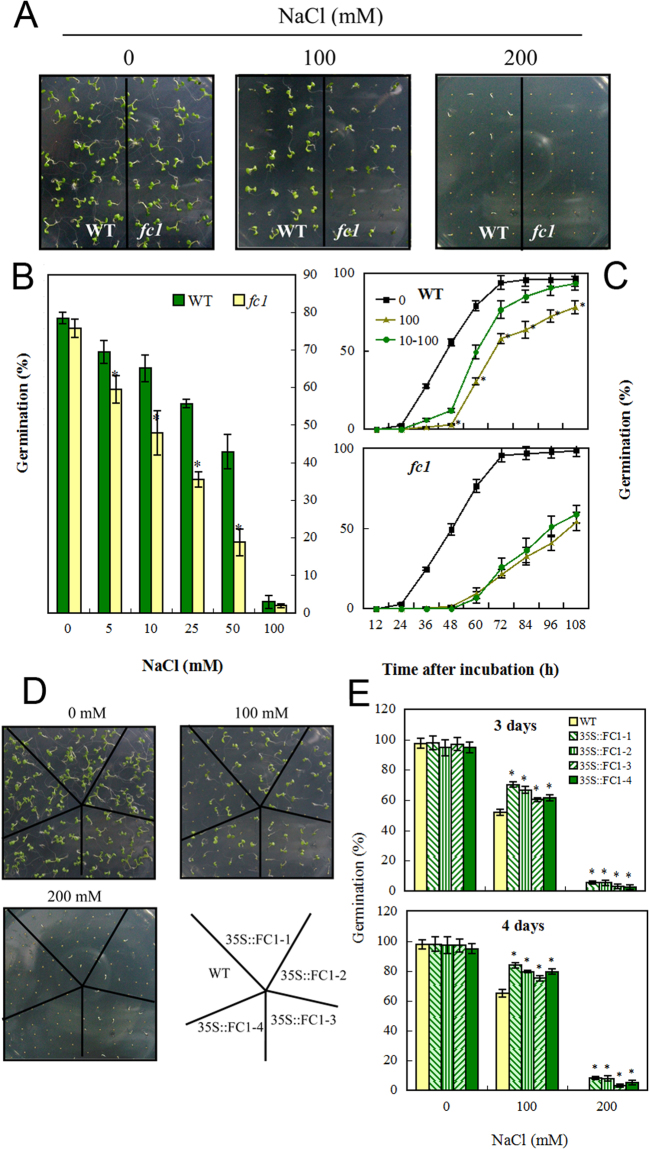
Figure 3.
Germination responses of fcl mutants and 35 S::AtFC1 plants to salt stress. (A) Phenotypes of wild-type (WT) and fc1 mutant seeds exposed to 0, 100 and 200 mM NaCl for 7 d. (B) Quantification of germination rates of WT and fc1 seeds with 0–100 mM NaCl for 2 d. C: Quantification of germination rates of WT and fc1 seeds in an acclimation way of 10 mM NaCl pre-treatment for 48 h (circles) and then 100 mM NaCl to the end of treatment (108 h) (triangles). Both 0 (square) and 100 (circles) mM NaCl treatments were set as control. D: Phenotypes of wild-type (WT) and 35 S::AtFC1 lines exposed the indicated concentrations of NaCl for 7 d. E: Quantification of germination rates of WT and fc1 seeds with 0, 100 and 200 mM NaCl for 3 or 4 d. Vertical bars represent mean values ± SE. Asterisk indicates the significant difference in germination rate between fc1 mutants/35 S::AtFC1 lines and wild type (p < 0.05).

