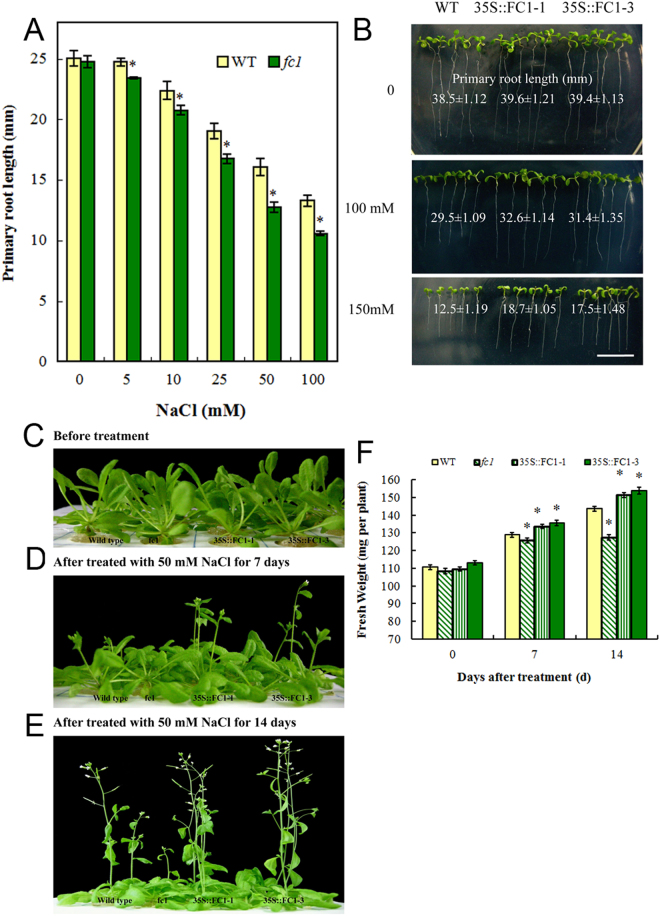
Figure 4.
Growth responses of fc1 and 35 S::AtFC1 plants to salt stress. (A) Primary root growth of wild-type and fc1 germinating seedlings with 0–100 mM NaCl for 7 d. (B) Phenotype of elongation of primary roots of 35 S::AtFC1 plants with 0, 100 and 200 mM NaCl for 10 d. (C–E) Phenotype of shoots of three week-old WT, fc1 and 35 S::AtFC1 plants exposed to 0, 100 and 150 mM NaCl for 7 and 14 d. (F) Quantification of fresh weight of plants treated with NaCl under the same condition of (C–E). Vertical bars represent mean values ± SE. Asterisk indicates the significant difference in fresh weight between the fc1/35 S::AtFC1 lines and wild type (p < 0.05).

