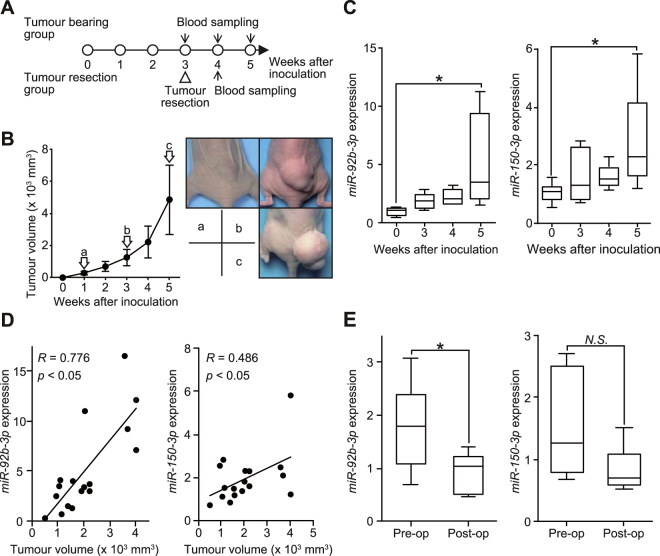
Figure 2.
Serum expression levels of candidate miRNAs during tumour development in SS-bearing mice. (A) Scheme of the animal experiment. (B) The tumour volume plotted each week after tumour inoculation (left). The macroscopic appearance of SYO-1 tumours in each group of mice 1, 3 and 5 weeks after tumour injection are shown (right). (C) Serum miR-92b-3p and miR-150-3p expression at 0, 3, 4, and 5 weeks after tumour inoculation. *p < 0.05; Student’s t test (D) Pearson’s correlation between miR-92b-3p and miR-150-3p levels and tumour volume (R = 0.776 for miR-92b-3p, R = 0.486 for miR-150-3p, p < 0.05, respectively). (E) Relative serum miR-92b-3p and miR-150-3p levels at pre- and postoperative stages (n = 6 in each group) *p < 0.05; Student’s t test.

