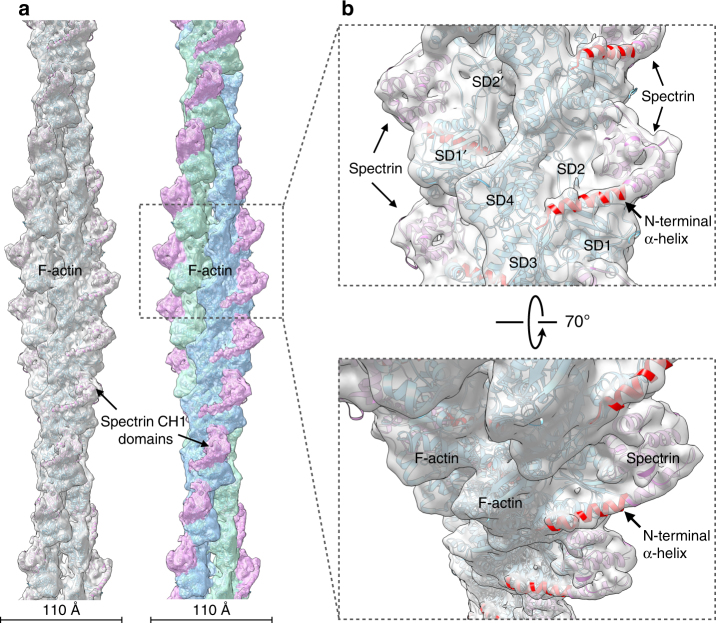
Fig. 1.
Cryo-EM map and model of L253P β-III-spectrin ABD bound to actin. a The map (left, gray transparent surface) has been fit with a model for actin (cyan) and the β-III-spectrin ABD (magenta). On the right, the surface of the reconstruction has been color coded for the two actin strands (blue and green) and the β-III-spectrin ABD (magenta). b Close-up view of a showing that the CH1 domain has an additional N-terminal helix (red) interacting with F-actin. The actin subdomains (SD1, SD2, SD3, and SD4) have been labeled on one actin subunit, while SD1′ and SD2′ are labeled on a different subunit

