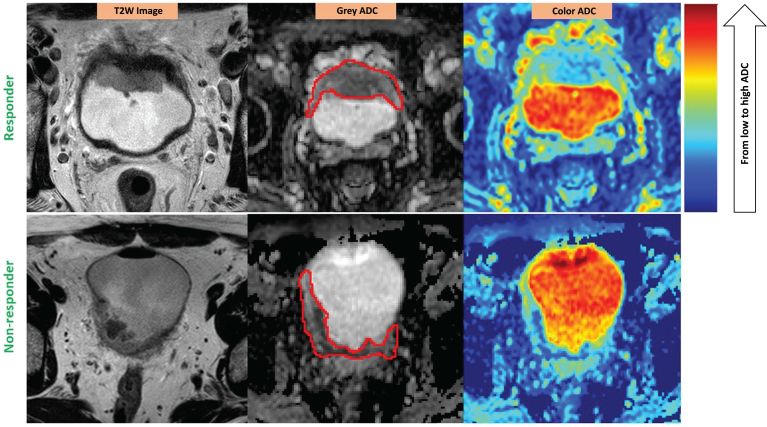
Fig.2.
ADC heterogeneity in the bladder tumor of a responder (upper) vs. a non-responder (lower). Red contours illustrate the ROIs placed on the tumors. The color scale column is given on the right. ADC values are scaled with the color spectrum from the lowest ADC at the bottom to the highest ADC at the top of the column. Please note that higher micro-cellularity underlies lower ADC in tumor tissues. Responder (stage pT1N0): U = 0.08; E = 3.81; Non-responder (stage pT3bN0): U = 0.06; E = 4.12.

