Fig. 1.
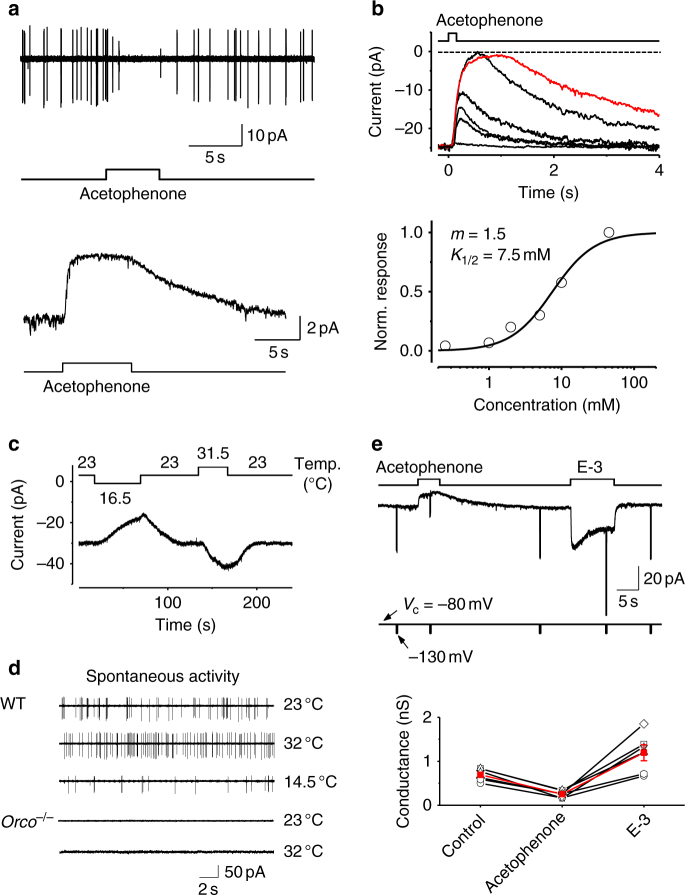
Outward receptor currents induced by inhibitory odors in Or85a-expressing OSNs. a Acetophenone (10 mM) abolishes the spontaneous firing (cell-attached recording, top) and triggers an outward receptor current (perforated patch-clamp recording, voltage-clamped at −80 mV, bottom). The timing of odor application is indicated. b Dose–response relationship of the odor-evoked inhibition. Top, superimposed traces of responses to 150-ms pulses of acetophenone at 0.25, 1.25, 5, 10, and 45 mM. The inhibitory responses to acetophenone at 45 mM (maximal water solubility) with durations of 150 and 500 ms (red trace) exhibit the same peak amplitude and reduce the basal inward current to 0 pA. Each trace is the average of 5–10 trials. Bottom, the normalized dose–response relationship. The fit is the Hill equation, R/R max = C m / (C m + K 1/2 m), where R is the peak-response amplitude, R max is the saturated peak response, C is the odor concentration, K 1/2 is the odor concentration that half-saturates the response, and m is the Hill coefficient. In this experiment, K 1/2 = 7.5 mM and m = 1.5. Collective results (n = 4): K 1/2 = 27 ± 13 mM, and m = 1.4 ± 0.2. c Temperature dependence of the basal inward current in WT flies. d Temperature dependence of spontaneous firing in WT flies (three top traces) and Orco −/− flies (two bottom traces). e Odor-evoked inhibition decreases membrane conductance. Top, membrane conductance was monitored using 10-ms voltage pulses (stepping from the holding voltage of −80 mV to −130 mV) before, during, and after the application of acetophenone (10 mM) and ethyl 3-hydroxybutyrate (E-3) (1 mM). The timing of odor stimulation and voltage pulses is indicated above and below the response trace, respectively. Bottom, collective data of membrane-conductance changes, with average indicated in red

