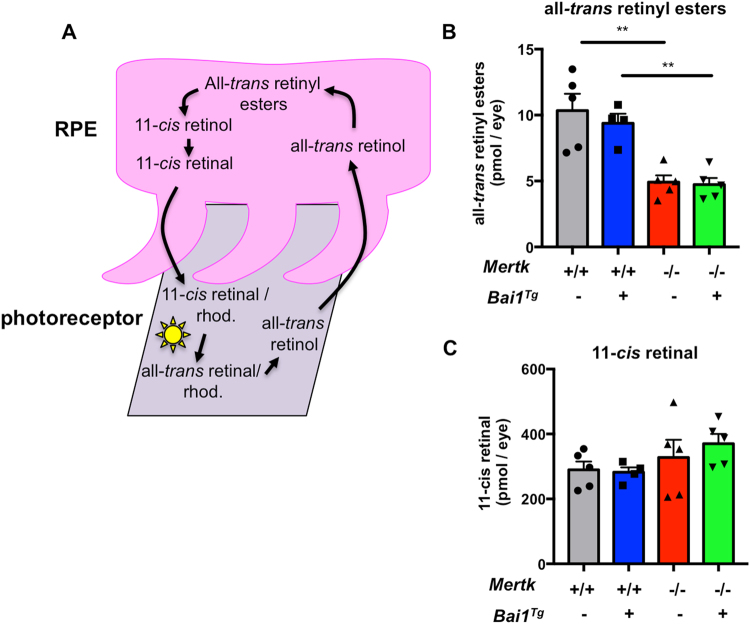
Figure 6.
Mertk −/− mice have reduced retinyl ester accumulation. (A) Schematic of the visual (retinoid) cycle that occurs in RPE (pink) and POS (gray). (B) P20-P21 mice were dark adapted overnight and HPLC analysis was performed to quantify all-trans-retinyl esters and (C) 11-cis-retinal. Individual points within bars are the average value for both eyes from one mouse: Mertk +/+(n = 5) Mertk +/+ Bai1 Tg (n = 4) Mertk −/− (n = 5) Mertk −/− Bai1 Tg (n = 5). Error bars represent SEM. Statistical analysis was performed by one-way ANOVA. Multiple comparisons were corrected with a post-hoc Tukey’s test. **p < 0.01.

