Fig. 3.
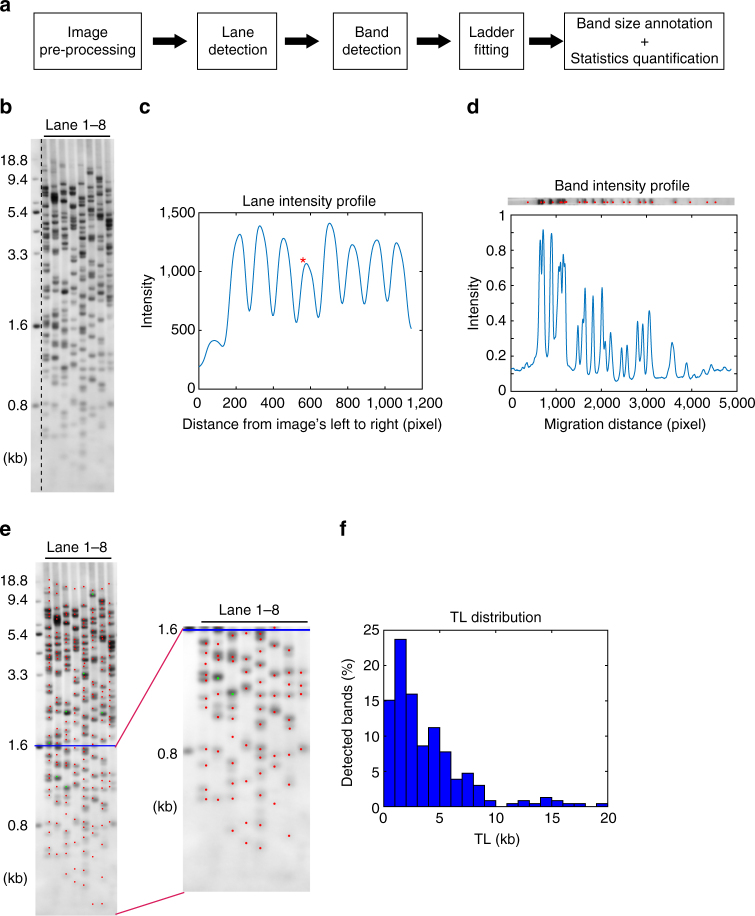
Overview of TeSLA image quantification software. a The computational analysis pipeline automatically detects each telomere band location, then annotates the band sizes, and calculates the relevant statistics (e.g., average TL, the ratio of shortest TL, TL at 20th percentile, and telomeres below 1.6 kb). b Example of input TeSLA image, tiff format recommended. On the left side of the image is the ladder lane with a standard size of 0.8–18.8 kb. c Lane profile, generated by summarizing the pixel intensity values vertically from left to right. Each peak indicates one lane detected by the software. d Band profile of lane 4, marked with the asterisk in c. The band profile is generated for each lane by horizontally summarizing pixel intensity values. Each significant peak refers to an individual band. e Example of the final output with the zoom-in of shortest telomere bands. Red dots indicate individual bands. Green dots mark the overlapping bands that are counted twice or three times. The blue line crosses the marker of 1.6 kb, which is the default threshold of shortest TL that other methods cannot reach. The software can calculate the ratio of TL below any given threshold. f Histogram of TL distribution, which covers the range of 0–20 kb

