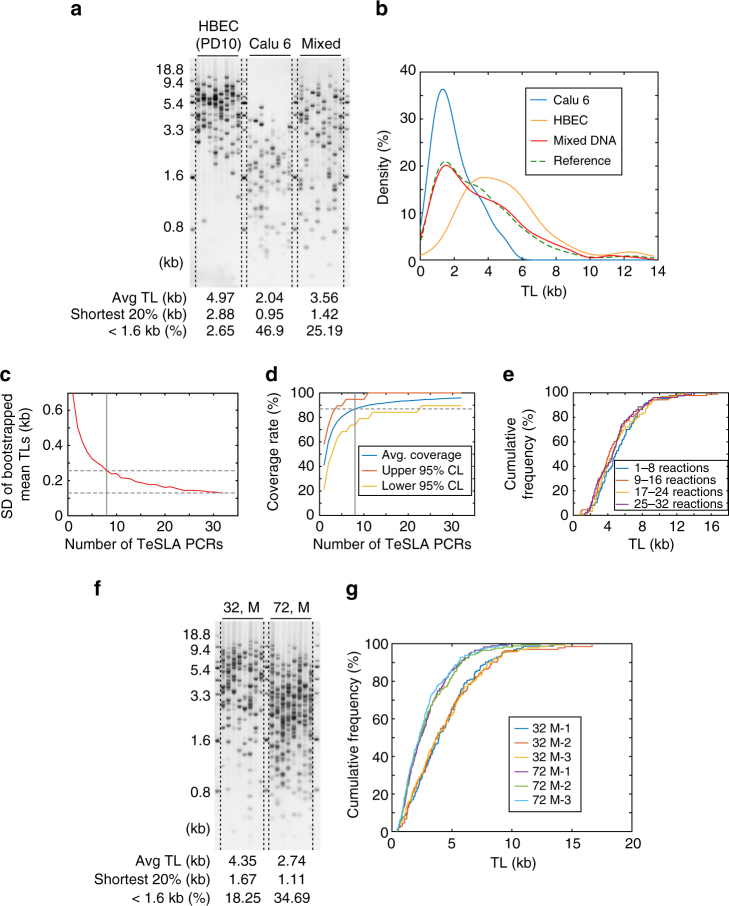
Fig. 4.
Assessment of different variations of TeSLA. a TeSLA of human bronchial epithelial cells (HBECs), Calu 6 (lung cancer cell line), and mixed DNA (HBEC: Calu 6 = 1:1) using 30 pg of DNA for each TeSLA PCR. b The kernel density estimation of TL from TeSLA results of Calu 6 (blue), HBEC (orange), and mixed DNA (red). The reference line (green dashed) represents a theoretical density function of TeSLA results when HBEC: Calu 6 = 1:1. c Standard deviations of bootstrapped distributions of mean TLs computed from 32 TeSLA PCRs of HBECs (Supplementary Fig. 4a) show the estimation accuracy achieved by using n (1 ≤ n ≤ 32) lanes to estimate the mean TL. d Coverage rates estimated from 32 TeSLA PCRs of HBECs (Supplementary Fig. 4a) based on bootstrapping. When eight PCRs were randomly selected from the 32 PCRs, 87% of all telomeres were detected with bin sizes 0.5 kb ranging from 0 to 10 kb. Red (yellow) line indicates upper (lower) 95% confidence bounds of the coverage rates. e Empirical distribution curves of quadruplets (eight TeSLA PCRs of each) from TeSLA results for HBECs show no significant changes in each eight TeSLA PCRs. f Representative TeSLA results of PBMCs from a young (age 32) and an old (age 72) individual. g Empirical distribution curves of TLs from the TeSLA of the triplicate results (blue, red, and yellow lines) for the 32-year-old male and triplicate results for the 72-year-old male (purple, green, and sky blue lines)

