Fig. 11.

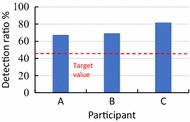
Detection rate for each subject. The discrimination ratios of participants A, B and C are 69, 69.4 and 77.1%, respectively. The target value is 45%

Detection rate for each subject. The discrimination ratios of participants A, B and C are 69, 69.4 and 77.1%, respectively. The target value is 45%