
Fig. 9.
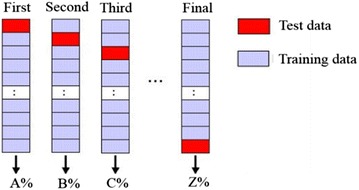
Cross-validation method. The red blocks represent test data. The purple blocks represent training data. First, we considered the first data block as test data, and all other data blocks training data. Second, we considered the second data block as test data, and all other data blocks training data. We repeated this procedure k times