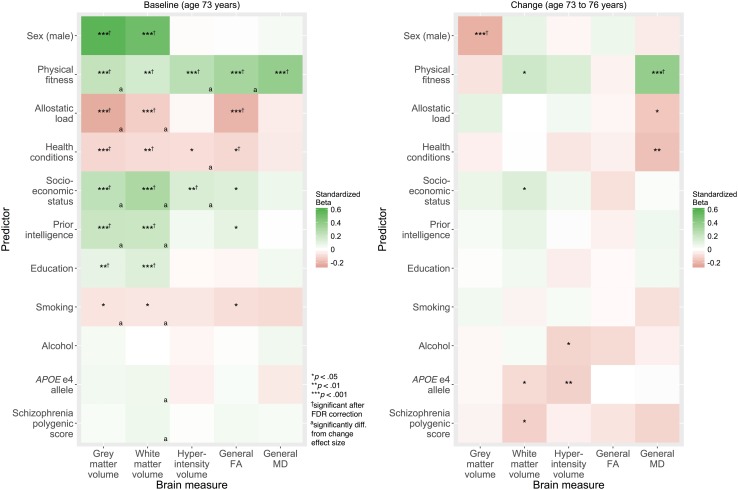
Fig. 4.
Associations of each predictor with baseline levels of (left) and changes in (right) each brain measure (all associations adjusted for age and sex). Brain variables scaled such that positive associations (green) indicate healthier brain baseline levels and brain ageing, and negative associations (red) indicate unhealthier brain baseline levels and brain ageing. Hyperintensity = white matter hyperintensity; FA fractional anisotropy; MD mean diffusivity. * p < 0.05, ** p < 0.01, *** p < 0.001; †significant after false discovery rate (FDR) correction; aeffect size for baseline was significantly different from effect size for change

