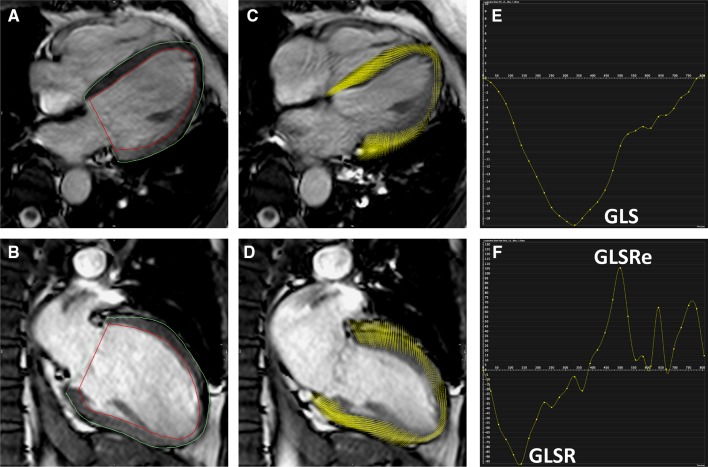
Fig. 1.
Calculation of GLS using CMR feature tracking in a healthy control. Panel A 4Ch cine acquisition with manually contoured epicardial and endocardial borders. Panel B 2Ch cine acquisition with manually contoured epicardial and endocardial border. Panel C feature tracking of 4Ch cine acquisition. Panel D feature tracking of the 2Ch cine acquisition. Panel E graph showing GLS [x axis shows time (ms) and y axis shows deformation (%) in longitudinal plane]. Panel F graph showing longitudinal strain rate [x axis shows time (m/s) and y axis shows deformation rate (%/s)]

