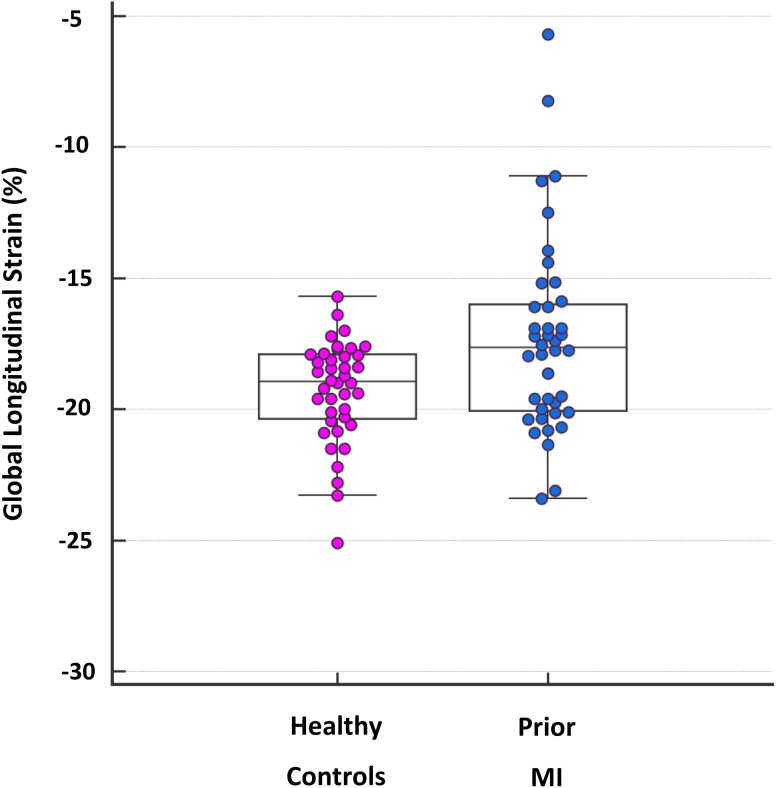
Fig. 2.
Box and whisker plot for GLS in prior MI and healthy controls. GLS values for all prior MI patients and healthy controls are shown as individual data points. For both groups, the horizontal line in the middle of the box demonstrates median values, the bottom of the box represents the 25th percentile and the top of the box represents the 75th percentile. The T-bar ‘whiskers’ represent the 95% confidence intervals

