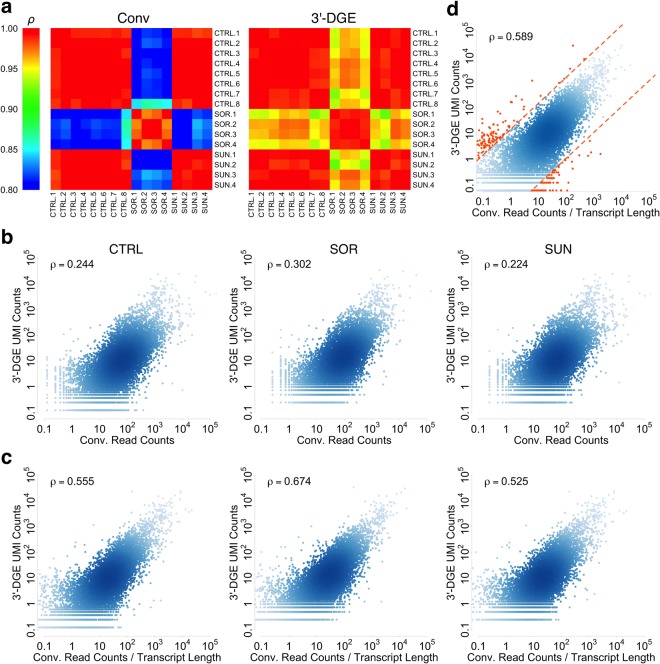
Figure 4.
Quantitative Comparison between Conventional (Conv) and 3′-end Digital Gene Expression (3′-DGE) mRNA Sequencing Methods. (a) Correlations of the replicate samples from the Conv read counts and 3′-DGE read counts show that the replicate samples obtained by the same method correlate well with each other under each condition. Control (CTRL), Sorafenib (SOR), Sunitinib (SUN). Pearson correlation is used. (b,c) Quantitative gene-wise comparison between Conv read counts and 3′-DGE UMI counts. Datasets are downsampled to a common read depth of 2.8 million reads, and then gene-by-gene comparisons are made via scatter plots. To generate a reduced UMI count dataset, upon removal of a read count, UMI counts were removed with probability proportional to the ratio between UMI counts and read counts for that gene (accounting for PCR bias). Density of points in scatter plots is indicated by depth of color. Inset text box shows Pearson correlation. In all plots, data are scaled so units are comparable. (b) Scatterplots of UMI counts for 3′-DGE versus read counts for conventional, without normalization by average transcript length. There is a general trend of agreement but correlation is low for quantitative agreement. (c) Scatterplots of UMI counts for 3′-DGE versus transcript length-normalized read counts for conventional. Quantitative agreement is significantly improved upon this normalization. (d) Potential biases of 3′-DGE or Conv techniques. We averaged data from all 16 read depth-normalized samples and defined lines that flank the typical variance in the data to identify genes that have evidence of bias in quantification. Genes falling outside of this range are reported in Tables S5,S6.

