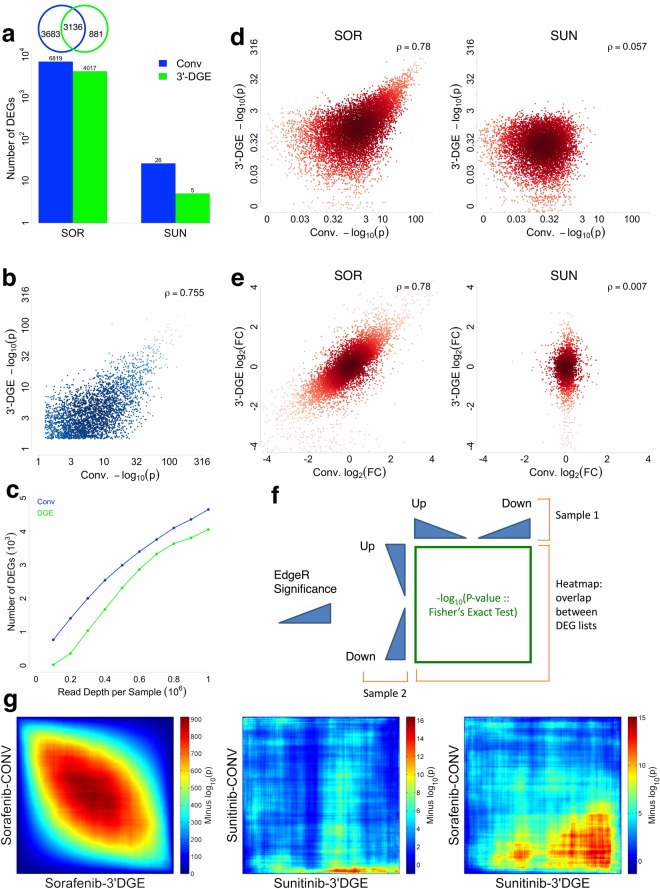
Figure 5.
Differential Gene Expression Analysis between Conventional (Conv) and 3′-end Digital Gene Expression (3′-DGE) mRNA Sequencing Methods. (a) Control (CTRL) data are compared Sorafenib (SOR) or Sunitinib (SUN) to identify differentially expressed genes (DEGs) using EdgeR for both Conv and 3′-DGE datasets. A gene is defined as differentially expressed using a false discovery rate (FDR) cutoff of 0.1. (b) Comparison of statistical significance for the 3,136 shared differentially expressed genes (DEGs) from Sorafenib-treated samples in 3′-DGE and Conv methods with FDR <0.1. The negative base-10 logarithm of the p-value for differential expression is plotted for each technique, with depth of color indicating density of points. Pearson’s correlation coefficient is indicated with the inset text. (c) Identification of Differential Expression as a Function of Read Depth. The number of differentially expressed genes (DEGs, FDR < 0.1) was quantified after progressive downsampling of UMI counts from 3′-DGE datasets or read counts from conventional (Conv) datasets (for Sorafenib vs. CTRL). (d) Comparison of statistical significance for all genes identified from SOR-treated samples and SUN-treated samples by two methods. The negative base-10 logarithm of the p-value for differential expression is plotted for each technique, with depth of color indicating density of points. The Pearson correlation coefficient is calculated for each treatment. (e) Comparison of fold change for all genes identified from SOR-treated samples and SUN-treated samples by two methods. The log base two fold-change is plotted for each technique, with depth of color indicating density of points. The Pearson correlation coefficient is calculated for each treatment. (f,g) Rank-rank Hypergeometric tests for consistency of differential expression ranking and gene expression signatures. (f) All genes for which a p-value for differential expression was calculated were first sorted into up or down regulated genes (as compared to CTRL), and then ranked by statistical significance. The probability of overlap between two different such rank lists was calculated with Fisher’s Exact Test (aka hypergeometric test), and visualized with a heatmap, for all combinations of list cutoffs. (g) Pairwise comparisons of SUN- and SOR-treated data for 3′-DGE and conventional. SOR-treated samples show much higher relative statistical significance, as expected, because only SOR induced large changes in gene expression. Note the difference in p-value scales across the three panels, which indicate the relative statistical significance of the results.

