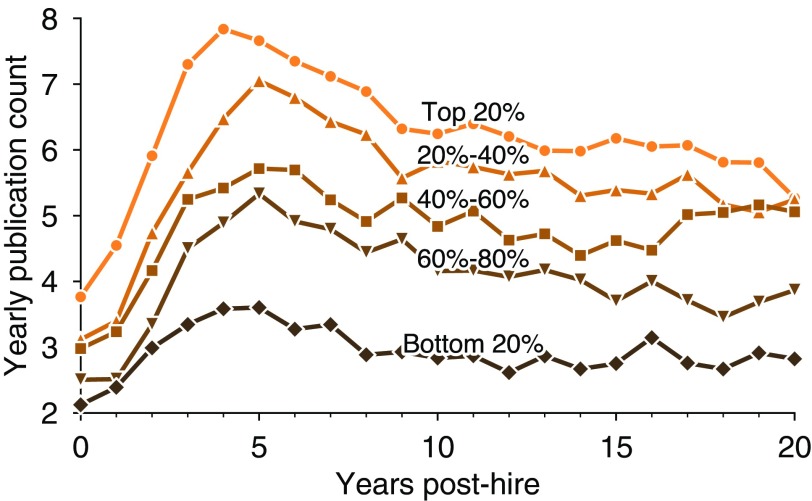
Fig. 2.
Average publications follow conventional narrative across prestige. Five average productivity curves are shown, partitioning universities according to prestige rank such that each quintile represents ∼20% of all faculty in the full dataset. Averages over researchers at all levels of institutional prestige follow similar productivity trajectories, in agreement with the conventional narrative, but at differing scales of output.

