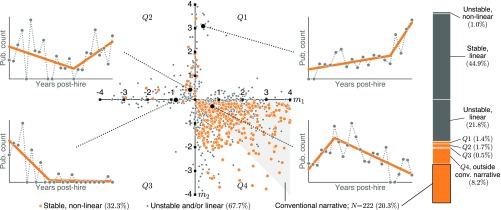
Fig. 4.
Distribution of individuals’ productivity trajectory parameters. Diverse trends in individual productivity fall into four quadrants based on their slopes and in the piecewise linear model Eq. 1. Plots show example publication trajectories to illustrate general characteristics of each quadrant. The shaded triangular region (Bottom Center) corresponds to the conventional narrative of early increase followed by gradual decline. Color distinguishes trajectories in two classes: those that are stable and nonlinear (orange) and those that are either unstable or linear (gray). The plot at Right describes how researchers are distributed within these two classes. conv. narrative, conventional narrative; Pub, publication.

