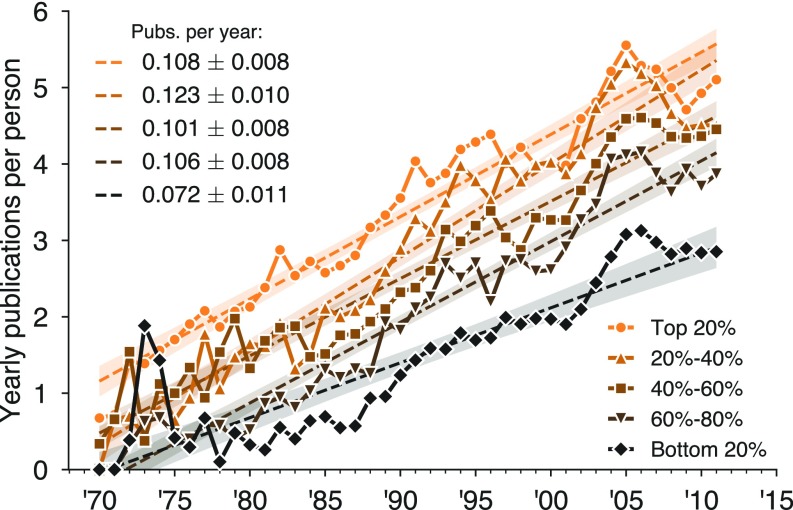
Fig. S3.
Annual publication rates have grown steadily. For faculty in this study, per-person annual publications have increase over time at a rate of approximately one additional paper every 10 years. This rate of growth affects researchers at all levels of prestige rank (26). Slopes represent least-squares linear regressions, with shaded regions denoting corresponding 95% confidence intervals. Pubs, publications.

