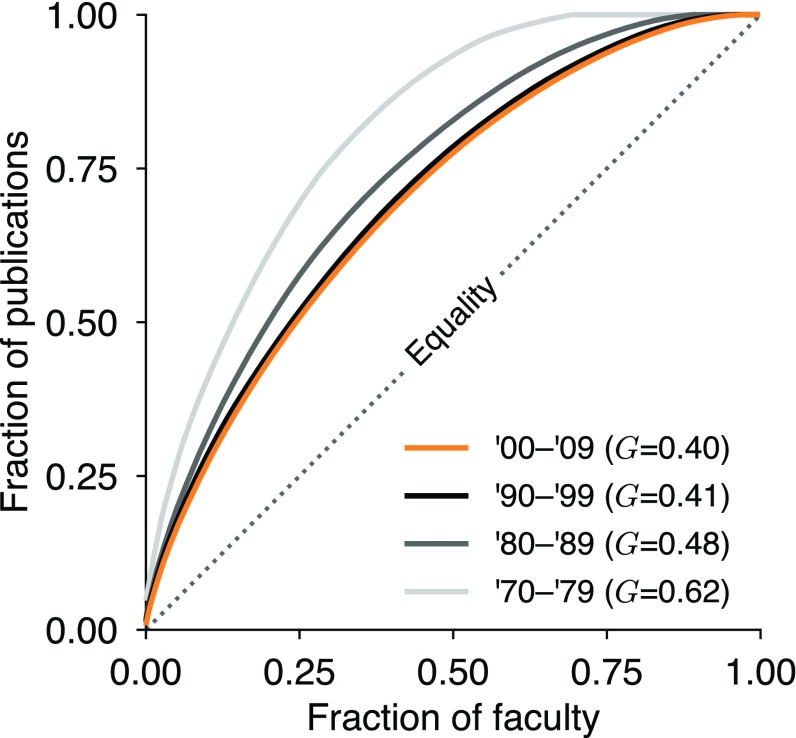
Fig. S5.
Production imbalance among faculty. Lorenz curves of adjusted production by in-sample faculty, stratified by decade of first hire (key), show that ∼20% of faculty account for half of all publications in the dataset. The Gini coefficient for each curve is noted in the key; the diagonal line indicates equal production by all faculty.

