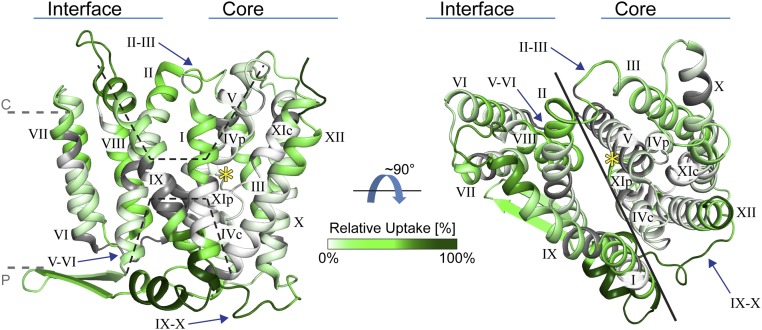
Fig. 1.
Deuterium uptake of NhaA. NhaA (PDB ID 4au5) is viewed parallel and normal to the membrane (dashed gray lines), and the TMs are numbered. Dashed lines show the cytoplasmic (c) and periplasmic (p) funnels (Left), and a solid line shows the separation between the interface and core domain (Right). The loops connecting the two domains (arrows) and the unique NhaA-fold in proximity to the binding site (yellow star) are indicated. The structure is colored according to the relative deuterium uptake measured after 30 min of incubation in D2O in the presence of K+, from white to dark green (zero to maximum deuterium uptake), and gray indicates no sequence coverage.

