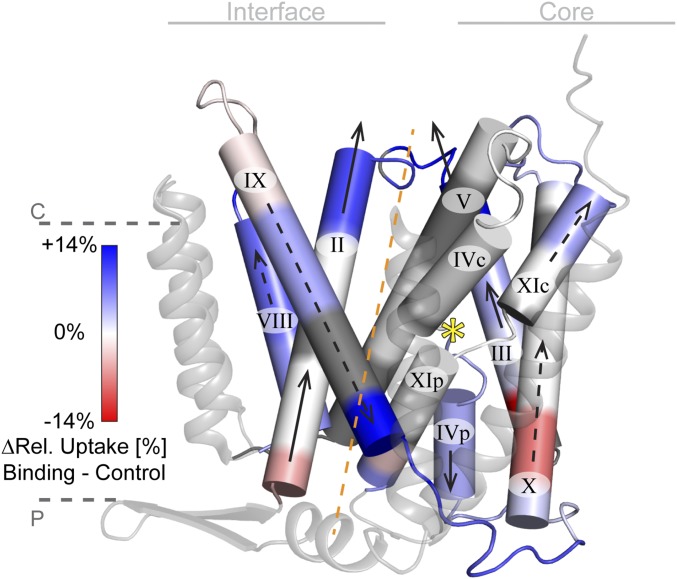
Fig. 4.
Schematic representation of movement 1 and 2. Cylindrical representation of the TMs and loops involved in the conformational changes upon Li+ binding viewed parallel to the membrane (color coding and indicators as in Fig. 2A). Arrows indicate the general movements of TMs upon Li+ binding in movement 1 (solid arrows) and movement 2 (dashed arrows) around the binding site (yellow star). The movements proceed along a central symmetry axis (dashed orange line) running through both funnel centers. TMs I, VI, VII, and XII are shown as transparent ribbons for clarity.

